
Utilizing Benford's Law as a Predictor for Crashes in the Stock Market
Grade 10
Presentation
No video provided
Problem
Benford’s law describes a phenomenon in which numbers like 1 and 2 appear more frequently as leading digits rather than numbers like 8 and 9 (Fewester, 2008, 1-2). 1 should occur approximately 30.1% of the time as the leading digit, 2 should occur 17.6% of the time, and 9 should occur 4.6% of the time (Fewester, 2008, 1). In simpler terms, smaller values should naturally occur more often than larger values in raw data sets (Berger et al., 2017, 1). Benford's law has a multitude of ways it can be applied, from financial fraud detection and forensics to even computer science and elections. It is commonly employed by accountants and forensic scientists when investigating sets of data to determine whether they have been manipulated or not (Kessel, 2020). While it is not a completely reliable method, Benford’s law still has the potential to be expanded further and be utilized in other ways like the Stock market.
The Stock market is infamous for its unpredictability and dramatic crashes, but can Benford’s law be used to predict crashes? By applying Benford’s law to data derived from the Stock market’s pre-crashes and post-crashes we can determine if Benford’s law is a viable method to foresee crashes if there are deviations in the leading digit frequencies. In the case Benford’s law does deviate pre-crashes, then investors and economists can potentially use it as a tool to guide and navigate their investments and financial decisions.
Method
In order to determine if Benford’s law is a valid technique, I will be analyzing and implementing Benford’s law’s formula to several raw data sets extracted from previous stock market crashes including data before, during, and after said crashes.
- Background Research
- Form an extensive understanding of the theory and origins of Benford’s law
- Become proficient in implementing Benford’s law to a data set and determining whether it follows Benford’s law or not
- Compiling Market Data Sets
- Use Google Finance, Yahoo Finance, and Kaggle to find data
- Select specific market crashes to investigate and periods of stability to compare to
- Divide the cases being investigated into timelines: pre-crash, during, and post-crash recovery and compare to periods of stability
- Accumulate a variety of pieces of data from specified market crashes: trading volumes, daily closing prices, and market indices
- Applying Benford’s Law
- Extract leading digits from stock price and trading volume data
- Analyze frequency of each leading digit (1-9)
- Graph and compare distribution derived from each time period’s data and Benford’s expected distribution
- Determine Deviations
- Employ Chi-squared, Kolmogorov-Smirnov, and Mean Absolute Deviation test
- Compare results to hypothesis
- Differentiate conclusions from each market phase
- Compare and contrast deviations and findings during each phase
- Come up with potential explanations
- Compare and contrast deviations and findings during each phase
- Construct Predictive Models
- Utilize machine learning to detect patterns between deviations and crashes
- Logistic regression and decision trees
- Train the model using previous crash data
- Test out on current stock data
- Utilize machine learning to detect patterns between deviations and crashes
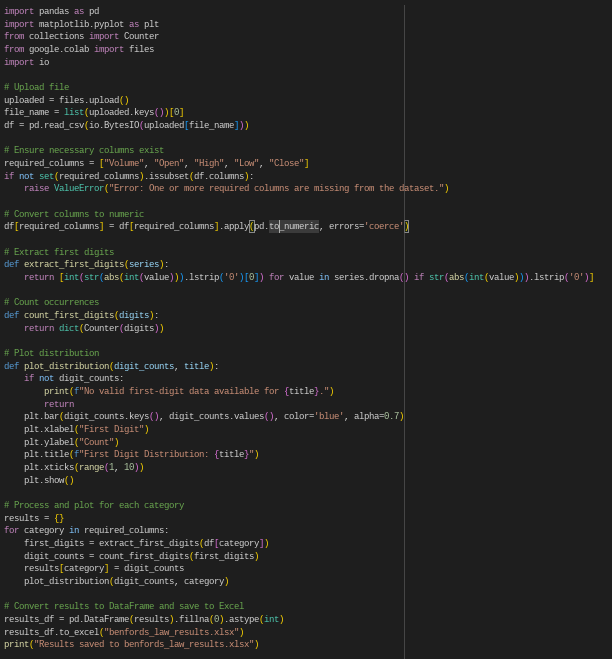
Below is code I operated in Google Colab to perform multiple operations and tasks in order to easily extract the leading digits from my data. The program first asks for a .cvs file with the data as input (the data must be formatted in a specific manner in order to be read correctly), and then analyzes and counts the first-digit from each section. The program then re-organizes the number of each leading-digit into another .cvs file that can be downloaded by the user, and fabricates a visual to graphicallu display the data.
Research
Background Research:
Initially discovered by Simon Newcomb (Canadian and American Astronomer / Mathematician) in 1881, Newcomb observed how dirty the early pages of the logarithm books were compared to their clean back pages (Berger et al., 2017, 1; Fewester, 2008, 1). From this observation Newcomb began investigating the frequency of leading-digits and mathematically determined a law that he expected these leading digits to follow (Fewester, 2008, 1).
P(leading digit = d) = log₁₀ (1 + 1/d ), d = 1, 2, …, 8, 9.
It wasn’t until 1938 that Frank Benford truly tested Newcomb’s law (Fewester, 2008, 1). Benford gathered 20 000 numbers from sources, such as Reader’s Digest Articles, population sizes, river drainage rates, atomic weights, and numerous others. Benford’s analysis and data revealed Newcomb's logarithmic rule to be true. While Frank Benford did coin a name for the law, he did not provide a persuasive explanation. Though he did state that the law only applied to anomalous numbers, and that orderly data like atomic weights were an exception to the law (Fewester, 2008, 1).
Intuitive reasoning and explanations for the law's effectiveness have been the scale-invariance and base-invariance arguments (Fewester, 2008, 2). Scale-invariance argues that if a potential universal law of nature is controlling the distribution, then the units should have no effect on the law’s validity. This would mean that Benford’s law is a universal law. The Base-invariance argument states that if Benford’s law applies in any base number system whether its binary, octal, etc it would be a universal law. Though, neither of these reasons explain why it would even be a universal law of nature to begin with (Fewester, 2008, 2).
Benford’s law is based on the mathematical theory that the probability of the leading-digit is log₁₀ of 1 plus 1 over the leading digit (Fewester, 2008, 3). When 1 is the leading-digit, X (a positive number drawn from a probability distribution) is exactly log₁₀(X) between n and n + 0.301 (n is the sample size and integer) (Fewester, 2008, 3).

Figure 1: A bar graph displaying the expected distribution of leading-digits as per Benford's equation.

Figure 2: A visual to display the logarithmic intervals of the first-digits according to Benford's expected distribution. Retrieved from https://insights.sei.cmu.edu/blog/benfords-law-potential-applications-insider-threat-detection/.
Data
In the table below, I have organized and divided each major crash event into 3 sections, Pre-Crash Period, Crash Period, and Post-Crash Recovery as the data will also be divided into these periods. The pre-crash period data will be able to show us if deviations begin to occur prior to a crash or if Benford's law remains true. The crash period will show us how the distributions when in a complete crash period and how Benford's law upholds. The post-crash period will discern whether or not deviations continue or decrease as the market recovers.
Time Frames
|
Crash Name: |
Year: |
Pre-Crash Period: |
Crash Period: |
Post-Crash Recovery: |
|
Great Depression |
1929 |
1928-1929 |
October 28, 1929 |
1930-1932 |
|
Black Monday |
1987 |
1985-1986 |
October 19, 1987 |
1988-1990 |
|
Dot-Com Bubble |
2000 |
1998-1999 |
March 10, 2000 |
2001-2002 |
|
2008 Financial Crisis |
2008 |
2006-2007 |
September 29, 2008 |
2009-2010 |
|
Covid-19 Crash |
2020 |
2018-2019 |
February 20, 2020 |
2021-2022 |
The three tables below are samples from my data sheet on excel to display how I arranged my data in it's final form before analyzing it further with statistical tests.
| S&P GD Pre-Crash Frequencies | |||||||||
| Category | 1 | 2 | |||||||
| Volume | 0.00% | 0.00% | |||||||
| Open | 39.72% | 60.43% | |||||||
| High | 39.72% | 60.43% | |||||||
| Low | 39.72% | 60.43% | |||||||
| Close | 39.72% | 60.43% | |||||||
| S&P GD Post-Crash Frequencies | |||||||||
| Category | 1 | 2 | 3 | 4 | 5 | 6 | 7 | 8 | 9 |
| Volume | 86.66% | 10.96% | 0.26% | 0.13% | 0.13% | 0.26% | 0.40% | 0.66% | 0.53% |
| Open | 0 | 43.18% | 56.82% | 0 | 0 | 0 | 0 | 0 | 0 |
| High | 0 | 42.54% | 57.46% | 0 | 0 | 0 | 0 | 0 | 0 |
| Low | 0 | 44.25% | 55.75% | 0 | 0 | 0 | 0 | 0 | 0 |
| Close | 0 | 43.20% | 56.80% | 0 | 0 | 0 | 0 | 0 | 0 |
| S&P GD Crash Frequencies | |||||||||
| Category | 1 | 2 | 3 | ||||||
| Volume | 0 | 0 | 0 | ||||||
| Open | 3.20% | 65.60% | 31.20% | ||||||
| High | 3.20% | 65.60% | 31.20% | ||||||
| Low | 3.20% | 65.60% | 31.20% | ||||||
| Close | 3.20% | 65.60% | 31.20% |
|
The table below is the expected distribution for Benford's law and I will be using it to compare to my tables, and to run the chi-square test on excel. The CHISQ.DIST function on excel will provide me with the chi-square statistic and the CHISQ.DIST.RT function will collect both the chi-square statistic and the degree of freedom, and dispense the p-value output. If the p-value is less than 0.05, there is a significant difference, and therefore Benford's law is valid (reject the null hypothesis), but in the case that the p-value is greater than 0.05 there is no significant difference, and I failed to reject the null hypothesis.
|
Leading-digit |
Expected Distribution (%) |
|
1 |
30.1 |
|
2 |
17.6 |
|
3 |
12.5 |
|
4 |
9.7 |
|
5 |
7.9 |
|
6 |
6.7 |
|
7 |
5.8 |
|
8 |
5.1 |
|
9 |
4.6 |
Conclusion
Sources of Error/Limitations/Next Steps:
If I were to continue this study in the future, I would test a larger variety of market indexes as S&P 500 does give a generalized overview of the state of the market along with Dow Jows Industrials Average and Nasqad Composite, but they mainly cover Western and American companies whereas Eastern or Southern markets may yeild different results. Additionally, I would broaden my categories to stock prices, dividends, and various other factors to test if they follow or deviate from Benford's distribution. Finally, I would also study smaller scale crashes to determine if the results still uphold.
A few limitations I encountered, was the inability to gain access to resources that would have otherwise allowed me to further enrich and strengthen my study as nearly all the data was behind paywall's and premimums. If I was instead enabled to use such resources I feel my project would have been better fortified and accurate. The lack of data on earlier historical data and the missing pieces of data is a potential source of error.
Utilizing Benford's law as a predictor for stock market crashes has shown to be not as applicable as expected, but still hold some potential as I plan on conducting further testing and research. Through further testing and research, Benford's law may still prove to have some use as a predicator, but the results from statistical testing show it is not significant enough. Older historical data shows less applicability while newer data follows Benford's law to a certain degree, therefore older data may be inaccurate or manipulated. From each category, the stock volume provided better results as they leading-digits had far more variety and consistently either followed or deviated from Benford's expected distribution.
Citations
Beers, B. (2024, November 6). Where Can I Find Historical Stock/Index Quotes? Investopedia. Retrieved March 18, 2025, from https://www.investopedia.com/ask/answers/find-historical-stock-index-quotes/
Berger, A., Hill, T. P., & Silva, C. E. (2017, February). What is Benford's Law. The Graduate Student Section, 64(2), 1-2. http://dx.doi.org/10.1090/noti1477
Caltech Quantitative Finance Group. (2017, February 14). Caltech Market Data Guide. Historical Stock Group. Retrieved March 18, 2025, from http://quant.caltech.edu/historical-stock-data.html
Fewester, R. M. (2008, October). A Simple Explanation of Benford’s Law. Teachers Corner, 1(1), 1-7. https://web.williams.edu/Mathematics/sjmiller/public_html/cmu/21-499/handouts/benford/Fewster_SimpleExplanationBenfordLaw.pdf
Kessel, E. (2020, December 17). Benford's Law: Potential Applications for Insider Threat Detection. Insights. https://insights.sei.cmu.edu/blog/benfords-law-potential-applications-insider-threat-detection/.
Acknowledgement
My sincerest thanks goes out to my parents, Harwinder and Lakha Sidhu, for their unconditional support and limitless care no matter what. I am truly grateful for all the love and effort you put into my well-being and happiness each day. I would also like to express my utmost appreciation for my friends who constantly motivated, aided, and up-lifted me throughout my project. Thank you, Sahji, Rayna, Riya, and Sampannata. My special thanks goes out to Japp for truly supporting me, and for helping my project reach its highest potential. I'd additionally like to indicate my gratitude towards my mentors, motivators, and coordinators Mr. Berry, Mr. Webster, Mr. Dossa, and Mr. Chiu. Each one of you has influenced and guided me to pursue science and foster my love for learning. Without you all, I genuinely could not have fabricated my project the way it is now.