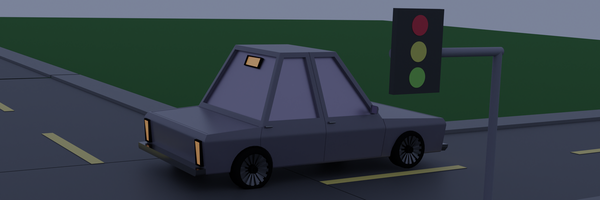
Staggering Brake Lights
Abbott Podavin
Grade 8
Presentation
No video provided
Hypothesis
Every car worldwide has single color red brake lights due to the efficiency at which red light can travel. Red light, unlike other kinds of light, can travel the farthest. Another commonly assumed reason is that red is a sign of danger, letting the vehicles behind know that the car is stopping and possible dangers if they don't follow. Despite every car having three red single variant brake lights there are still 2.5 million rear-ends reported in the USA every year. Rear-ends make up over 25% of all accidents in the USA. These accidents are mostly caused by negligence, speeding, following too close behind a car, and not being able to stop fast enough or not releasing that the car in front is stopping. Rear-ends mostly happen when a car is at a stop or going slowly (when the red brake light is already activated and the following car can not tell when they are stopping). Even though these accidents seem harmless airbags and seatbelts can cause the occupants to experience whiplash sometimes even causing spinal cord injuries and concussions.
Emergency brake lights have started to be implemented in European countries, these emergency brake lights have been proven to reduce rear-end collisions by almost 90%. Even though emergency brake lights could save hundreds of lives, they are illegal in North America. This is mainly because they would be confused for turn signals or hazards being the same flashing red color. They have been able to start implementing these in Europe because instead of a traditional red that we are used to they use amber turning signals and hazards. Since the emergency brake light is not allowed in the USA we have to look to other solutions. Such as staggering brake lights that could be even safer than emergency brake lights having more variants to let the following cars know at what rate the car is stopping.
If staggering brake lights are implemented instead of alternative red single color variants, then less rear end collisions will occur.
Research
In 1928, 11 out of the 48 states made brake lights required on every single car. Brake lights are lights on the rear end of vehicles that light up (red) whenever enough force is applied to the brake. These lights show other cars behind that the car is slowing down or coming to an abrupt stop. Brake lights helped drastically reduce rear-end collisions, and replaced drivers using hand signals (meaning they could not drive at night due to visibility). To improve the safety of brake lights in 1986 the National Highway Traffic Safety Administration made the third brake light law. Since this brake light has been implemented on all cars, there has been reduced property damage, accidents, and injuries. The main reason why the third brake light has been so beneficial is due to the fact that drunken drivers can have an extra warning when the car is abruptly stopping. If a third brake light can help reduce rear-end collision then imagine the possibilities with staggering brake lights.
Variables
Independent: The independent variable in this experiment is the different volunteers who participated in the brake test.
Dependent: The dependent variable in this experiment is the reaction time, stopping speed, successful stopping distance, amount of rear-ends, success rate and collision speed of the volunteers participating in the brake test.
Controlled: The controlled variable in this experiment is the brakes each volunteer used, the brake test, and the environment the volunteers conducted the test in (i.e. same chair, table, and room).
Procedure
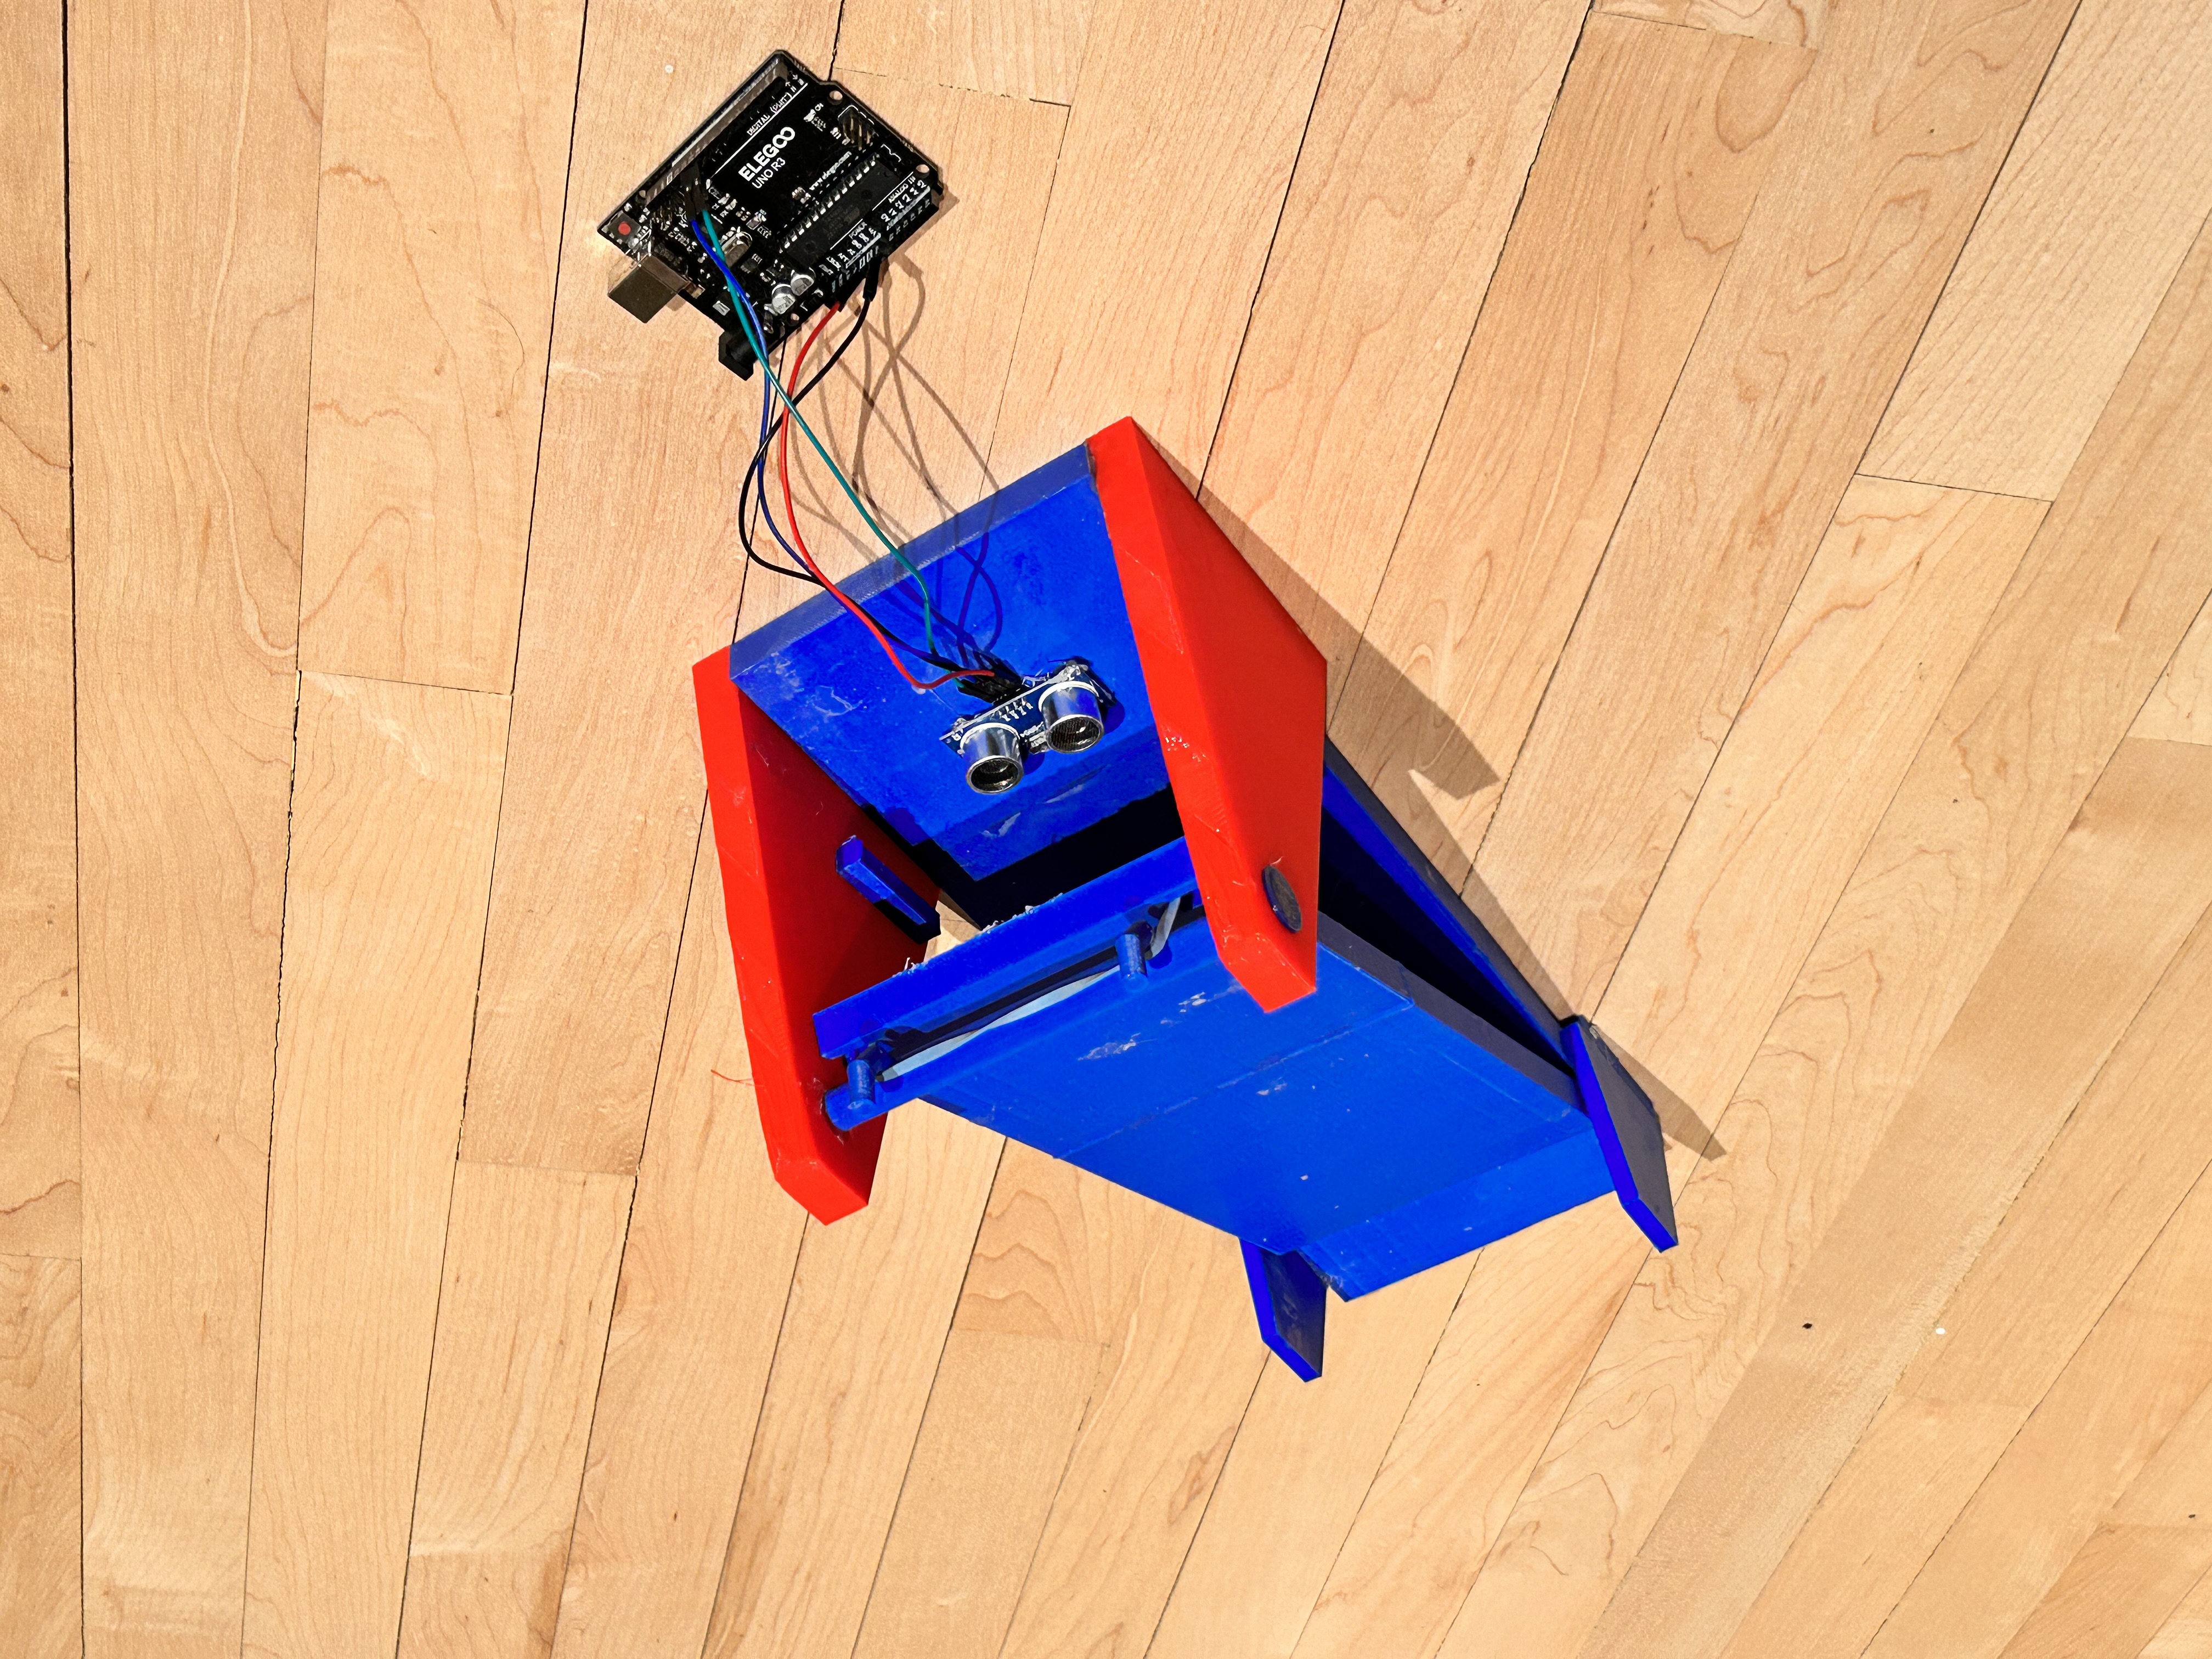
I created a simulator using an arduino and a 3D printer and then tested it using red brake lights and staggering brake light colours. This was my procedure.
- Print off pieces (using the 3d printer) and assemble with gorilla glue to make a rough brake
- String the elastic band around the brake to create resistance to brake
- Hot glue the Arduino board and sensor on to the brake
- Connect the Arduino board to the sensor and then to the computer
- Upload the sensor code to detect distance
- Get first participant ready to test (ie inform them of the rules, instructions, what to do, etc)
- Set the brake light color to red
- Test then record their results x2
- Switch the brake light color to staggering
- Test then record their results x2
- Repeat steps 6 to 10 for all participants
- 3d printer
- PLA filament
- Gorilla super glue
- Arduino board
- Distance sensor
- Arduino compatible cords
- Computer
- Unity
- Arduino/Unity compatibility add on
- Ardunio connection cord
- Elastic band
- Hot glue gun
- Hot glue stick
Observations
Reaction Speed Table of Values
|
Red Brake Light |
Colored Brake Light |
|
1.119 |
0.549 |
|
0.649 |
0.599 |
|
0.959 |
0.26 |
|
1.414 |
0.374 |
|
0.729 |
0.429 |
|
0.659 |
0.679 |
|
0.739 |
0.804 |
|
0.819 |
0.559 |
|
0.809 |
0.334 |
|
0.654 |
0.379 |
|
0.669 |
0.27 |
|
0.639 |
0.31 |
|
0.669 |
0.26 |
|
0.699 |
0.28 |
|
0.599 |
0.31 |
|
0.949 |
0.559 |
|
0.29 |
0.969 |
|
0.689 |
1.069 |
|
0.599 |
0.09 |
|
0.359 |
0.24 |
|
1.129 |
0.31 |
|
0.829 |
0.399 |
|
0.814 |
0.334 |
|
0.769 |
1.019 |
|
0.489 |
0.384 |
|
0.769 |
0.509 |
|
0.739 |
0.539 |
|
0.16 |
0.409 |
|
0.699 |
0.33 |
|
0.819 |
0.479 |
|
0.829 |
0.359 |
|
0.709 |
0.339 |
|
1.039 |
0.429 |
|
0.349 |
0.679 |
|
0.03 |
0.349 |
|
0.04 |
0.369 |
|
0.749 |
0.359 |
|
0.659 |
0.809 |
|
0.719 |
0.569 |
|
0.699 |
0.359 |
Brake Speed Table of Values
|
Red Brake Light |
Colored Brake Light |
|
22.38 |
13.774 |
|
16.304 |
11.881 |
|
26.315 |
14.15 |
|
25 |
2.047 |
|
23.622 |
19.354 |
|
25 |
23.622 |
|
26.548 |
25 |
|
26.548 |
23.622 |
|
26.548 |
13.698 |
|
26.548 |
14.634 |
|
26.548 |
15.706 |
|
26.548 |
14.634 |
|
26.785 |
14.15 |
|
25 |
14.634 |
|
26.548 |
7.177 |
|
26.548 |
5.23 |
|
22.388 |
23.622 |
|
21.276 |
26.548 |
|
23.622 |
13.698 |
|
19.354 |
16.304 |
|
26.548 |
13.698 |
|
26.548 |
17.647 |
|
26.548 |
22.222 |
|
26.548 |
26.548 |
|
13.489 |
13.274 |
|
17.751 |
15.706 |
|
16.949 |
8.645 |
|
12.145 |
11.764 |
|
23.622 |
19.23 |
|
25 |
18.518 |
|
26.315 |
14.084 |
|
26.528 |
23.622 |
|
26.315 |
26.548 |
|
18.515 |
25 |
|
15.706 |
20.27 |
|
16.393 |
26.528 |
|
26.528 |
20.134 |
|
26.78 |
17.751 |
|
26.548 |
16.949 |
|
26.548 |
20.27 |
Total Brake Time Table of Values
|
Red Brake Light |
Colored Brake Light |
|
1.134 |
2.254 |
|
1.134 |
2.534 |
|
2 |
2.119 |
|
1.334 |
14.65 |
|
1.99 |
1.269 |
|
1.269 |
1.199 |
|
1.129 |
1.264 |
|
1.129 |
1.549 |
|
1.129 |
2.049 |
|
1.129 |
1.909 |
|
1.129 |
2.189 |
|
1.129 |
2.049 |
|
1.129 |
5.73 |
|
1.129 |
4.18 |
|
1.199 |
2.049 |
|
1.119 |
2.119 |
|
1.549 |
1.129 |
|
1.269 |
1.269 |
|
1.409 |
1.839 |
|
1.334 |
2.189 |
|
1.129 |
1.699 |
|
1.129 |
2.189 |
|
1.129 |
1.129 |
|
1.129 |
1.349 |
|
2.469 |
2.549 |
|
1.769 |
3.469 |
|
1.689 |
1.909 |
|
1.549 |
2.259 |
|
1.129 |
1.269 |
|
1.139 |
2.129 |
|
1.199 |
1.619 |
|
1.269 |
1.559 |
|
1.829 |
1.199 |
|
1.909 |
1.129 |
|
1.619 |
1.129 |
|
1.139 |
1.479 |
|
1.129 |
1.684 |
|
1.129 |
1.489 |
|
1.119 |
1.479 |
|
1.129 |
1.769 |
Complete Table of Values
|
Total Brake Time Red Brake Light |
Total Brake Time Colored Brake Light |
Bradke Speed Red Brake Light |
Brake Speed Colored Brake Light |
Reaction Speed Red Brake Light |
Reaction Speed Colored Brake Light |
Gender |
Age |
Drivers License |
Accidents |
Driving Level |
Computer Experience |
Computer Skill |
|
1.134 |
2.254 |
22.38 |
13.774 |
1.119 |
0.549 |
Female |
8 |
None |
0 |
1 |
5 |
5 |
|
1.134 |
2.534 |
16.304 |
11.881 |
0.649 |
0.599 |
Female |
8 |
None |
0 |
1 |
5 |
5 |
|
2 |
2.119 |
26.315 |
14.15 |
0.959 |
0.26 |
Female |
8 |
None |
0 |
1 |
5 |
5 |
|
1.334 |
14.65 |
25 |
2.047 |
1.414 |
0.374 |
Female |
8 |
None |
0 |
1 |
5 |
5 |
|
1.99 |
1.269 |
23.622 |
19.354 |
0.729 |
0.429 |
Female |
47 |
Full |
2 |
9 |
8 |
7 |
|
1.269 |
1.199 |
25 |
23.622 |
0.659 |
0.679 |
Female |
47 |
Full |
2 |
9 |
8 |
7 |
|
1.129 |
1.264 |
26.548 |
25 |
0.739 |
0.804 |
Female |
47 |
Full |
2 |
9 |
8 |
7 |
|
1.129 |
1.549 |
26.548 |
23.622 |
0.819 |
0.559 |
Female |
47 |
Full |
2 |
9 |
8 |
7 |
|
1.129 |
2.049 |
26.548 |
13.698 |
0.809 |
0.334 |
Female |
15 |
Learners |
0 |
8 |
9 |
9 |
|
1.129 |
1.909 |
26.548 |
14.634 |
0.654 |
0.379 |
Female |
15 |
Learners |
0 |
8 |
9 |
9 |
|
1.129 |
2.189 |
26.548 |
15.706 |
0.669 |
0.27 |
Female |
15 |
Learners |
0 |
8 |
9 |
9 |
|
1.129 |
2.049 |
26.548 |
14.634 |
0.639 |
0.31 |
Female |
15 |
Learners |
0 |
8 |
9 |
9 |
|
1.129 |
5.73 |
26.785 |
14.15 |
0.669 |
0.26 |
Female |
16 |
Learners |
0 |
7 |
9 |
8 |
|
1.129 |
4.18 |
25 |
14.634 |
0.699 |
0.28 |
Female |
16 |
Learners |
0 |
7 |
9 |
8 |
|
1.199 |
2.049 |
26.548 |
7.177 |
0.599 |
0.31 |
Female |
16 |
Learners |
0 |
7 |
9 |
8 |
|
1.119 |
2.119 |
26.548 |
5.23 |
0.949 |
0.559 |
Female |
16 |
Learners |
0 |
7 |
9 |
8 |
|
1.549 |
1.129 |
22.388 |
23.622 |
0.29 |
0.969 |
Female |
15 |
Learners |
0 |
7 |
2 |
2 |
|
1.269 |
1.269 |
21.276 |
26.548 |
0.689 |
1.069 |
Female |
15 |
Learners |
0 |
7 |
2 |
2 |
|
1.409 |
1.839 |
23.622 |
13.698 |
0.599 |
0.09 |
Female |
15 |
Learners |
0 |
7 |
2 |
2 |
|
1.334 |
2.189 |
19.354 |
16.304 |
0.359 |
0.24 |
Female |
15 |
Learners |
0 |
7 |
2 |
2 |
|
1.129 |
1.699 |
26.548 |
13.698 |
1.129 |
0.31 |
Male |
76 |
Full |
3 |
10 |
7 |
6 |
|
1.129 |
2.189 |
26.548 |
17.647 |
0.829 |
0.399 |
Male |
76 |
Full |
3 |
10 |
7 |
6 |
|
1.129 |
1.129 |
26.548 |
22.222 |
0.814 |
0.334 |
Male |
76 |
Full |
3 |
10 |
7 |
6 |
|
1.129 |
1.349 |
26.548 |
26.548 |
0.769 |
1.019 |
Male |
76 |
Full |
3 |
10 |
7 |
6 |
|
2.469 |
2.549 |
13.489 |
13.274 |
0.489 |
0.384 |
Male |
13 |
None |
0 |
3 |
8 |
9 |
|
1.769 |
3.469 |
17.751 |
15.706 |
0.769 |
0.509 |
Male |
13 |
None |
0 |
3 |
8 |
9 |
|
1.689 |
1.909 |
16.949 |
8.645 |
0.739 |
0.539 |
Male |
13 |
None |
0 |
3 |
8 |
9 |
|
1.549 |
2.259 |
12.145 |
11.764 |
0.16 |
0.409 |
Male |
13 |
None |
0 |
3 |
8 |
9 |
|
1.129 |
1.269 |
23.622 |
19.23 |
0.699 |
0.33 |
Female |
50 |
Full |
0 |
8 |
7 |
7 |
|
1.139 |
2.129 |
25 |
18.518 |
0.819 |
0.479 |
Female |
50 |
Full |
0 |
8 |
7 |
7 |
|
1.199 |
1.619 |
26.315 |
14.084 |
0.829 |
0.359 |
Female |
50 |
Full |
0 |
8 |
7 |
7 |
|
1.269 |
1.559 |
26.528 |
23.622 |
0.709 |
0.339 |
Female |
50 |
Full |
0 |
8 |
7 |
7 |
|
1.829 |
1.199 |
26.315 |
26.548 |
1.039 |
0.429 |
Female |
15 |
Learners |
0 |
6 |
7 |
7 |
|
1.909 |
1.129 |
18.515 |
25 |
0.349 |
0.679 |
Female |
15 |
Learners |
0 |
6 |
7 |
7 |
|
1.619 |
1.129 |
15.706 |
20.27 |
0.03 |
0.349 |
Female |
15 |
Learners |
0 |
6 |
7 |
7 |
|
1.139 |
1.479 |
16.393 |
26.528 |
0.04 |
0.369 |
Female |
15 |
Learners |
0 |
6 |
7 |
7 |
|
1.129 |
1.684 |
26.528 |
20.134 |
0.749 |
0.359 |
Male |
49 |
Full |
11 |
8 |
7 |
6 |
|
1.129 |
1.489 |
26.78 |
17.751 |
0.659 |
0.809 |
Male |
49 |
Full |
11 |
8 |
7 |
6 |
|
1.119 |
1.479 |
26.548 |
16.949 |
0.719 |
0.569 |
Male |
49 |
Full |
11 |
8 |
7 |
6 |
|
1.129 |
1.769 |
26.548 |
20.27 |
0.699 |
0.359 |
Male |
49 |
Full |
11 |
8 |
7 |
6 |
Analysis
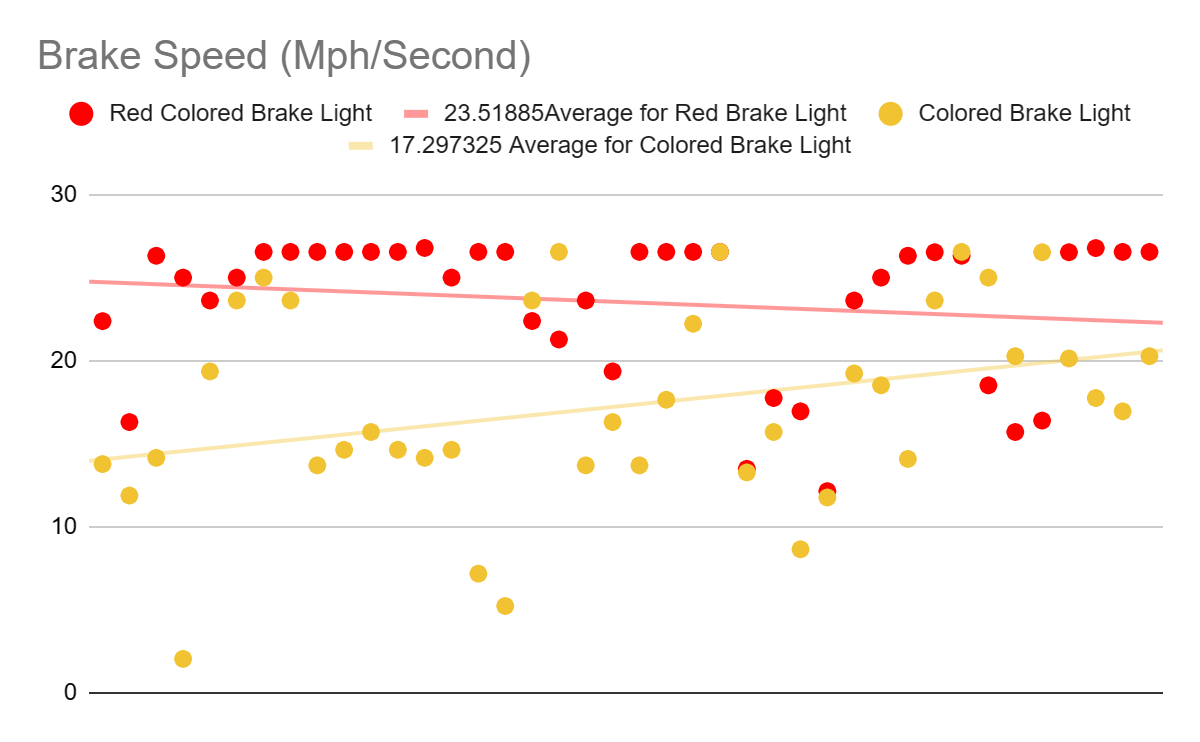
This project tested a wide range of ages and driving abilities, to see how they would react to a differently colored brake light. The participants tested both a normal red brake light (control) and a new colored brake light. On average when the participants were faced with the multi colored brake light they would brake over 6 MPH faster than when faced with a normal red brake light. This happened because the new colored brake light gave the participants more information about how hard the car in front of them was braking. Normally they would have to guess how fast the car in front of them was braking. This led to many miss brakes (i.e. the car was barely slowing down, but the participant slammed on the brakes believing the car to be coming to a quick hault). Participants faced this many times when using the red brake light. When the participants switched over to the multi colored brake light this was immediately fixed. The yellow-orange-red light allowed the participants to have a better understanding of how fast the car was braking and how much they should compensate. This change was especially the case for participants that were under the age of 16. This minority of participants exaggerated the increased colored brake light brake speed. Although this group on average made the greatest brake speed change, all across the board there was high levels of change when faced with the colored brake light.
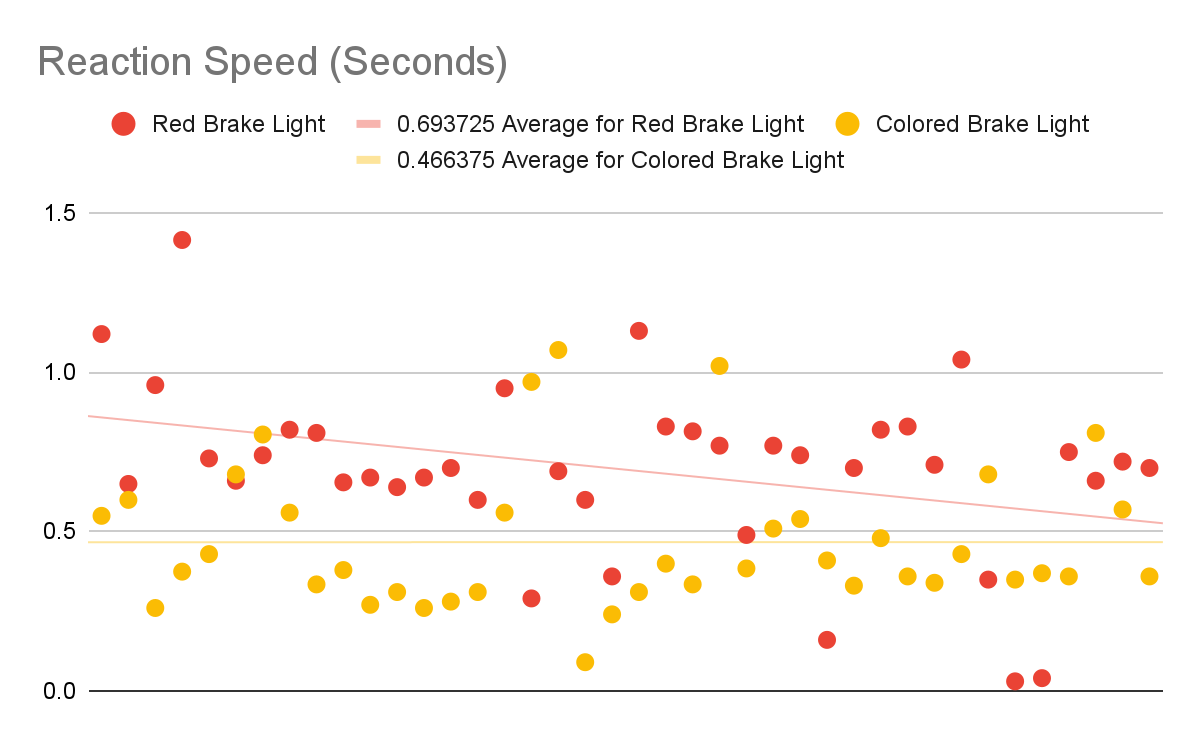
Participants overall showed over a .2 second faster reaction speed when testing with the colored brake light. When testing with the colored brake light the average reaction speed was .466 seconds. When testing with the red brake light the average reaction speed was .693 seconds. Only 2 tests out of 40 did anyone have a higher reaction speed then 1 second while testing with the colored brake light. When testing with the red brake light 4 tests out of 40 participants had a reaction speed of over 1 seconds. Majority of these were also above 1.1 seconds, whereas the test with the colored brake speed with a reaction speed over 1 were all under 1.1 seconds. This change was consistent with all participants that took place in this project.
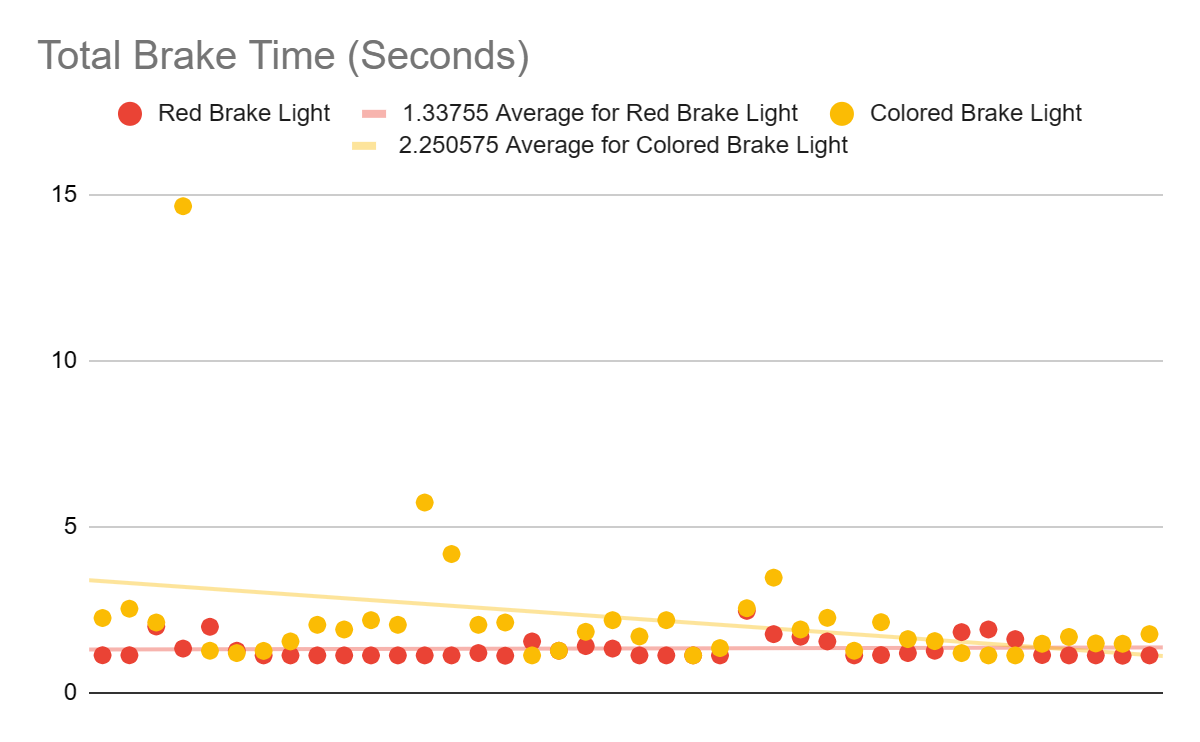
On average the total brake time of participants while testing the colored brake light was almost 1 second higher than the regular red brake light. Many participants even showed double or triple the brake speed on the alternative colored brake light. Only 3 tests out of the total 40 when using the colored brake light did a participant brake at the maximum speed. When the participants were faced with the red brake light 16 out of the total 40 times the participant slapped fully down on the brake. The colored brake light allowed the participants to react better to the car in front of them. Instead of coming to a quick stop, they would slowly brake following to yellow-orange-red on the car. This change was similar across all ages, but again was most prominent with participants under the age of 16.
Conclusion
In my hypothesis I predicted that If staggering brake lights are implemented instead of alternative red single color variants, then less rear end collisions will occur. This experiment proved my hypothesis right with the majority of the volunteers scoring better on the colored brake light. More people did better on the colored brake light because it gave them more time to react and allowed them to realize how much time they had to brake. The yellow-orange-red gave the participants a good idea of how fast the car in front of them was braking. Since they knew how fast they were braking they could adjust accordingly and brake more effectively then with a normal red brake light.
While using the colored brake light on average the total brake time was more than using the normal red brake light. This was also the case with most participants scoring slower on the brake speed while using the colored brake light. When participants used the colored brake light they recorded a faster reaction time on average. This means that even though most participants were used to red light, they could still react just as fast (sometimes even faster) when faced with a new colored brake light. Reaction time is important when braking, even a few milliseconds can be the difference between a crash and getting home safely.
This experiment is important because not only does it show that colored brake lights are more effective for reaction speed, it also shows that using a colored brake light can reduce the amount of time it takes to brake. This can reduce rear end collisions which made up over 25% of all accidents in America last year. Reducing brake speed can help reduce stress on brakes and can allow following cars more time to react to your changes in speed. Colored brake lights can very well save millions of dollars in damages and hundreds of lives if implemented correctly.
Application
With this information from this project, colored brake lights can be further tested in real life situations, too see just how beneficial they can be. Colored brake lights could eventually be implemented on cars across North America. This can help to reduce the amount of rear end collisions, because of the increased brake speed (allowing the following car to have longer to react). Colored brake lights will allow for drivers to see just how fast cars are breaking, which could be a crucial change to reducing accidents on the road. Colored brake lights can help save lights on the road by making sure cars don’t over brake or under brake (not being able to tell the difference with a plain red brake light). Colored brake lights allow the driver to more closely match the braking speed of the car in front of them. This allows them to stay the same distance apart (whatever the driver is comfortable with) as the car in front of them without changing distance randomly.
Another major benefit that this information allows for is less use of over braking, which can help save cars brakes from wearing out. Replacing brakes in a car can cost upwards of $1000, which can be very hard for some groups of people to afford. If colored brake lights are implemented this money can be used for more important things (food, housing, etc). Colored brake lights allow cars to stop over using braking systems which can help save friction and over use on the cars braking system.
Colored brake lights can help to reduce the amount of accidents that are caused by not knowing how fast a car is braking. Colored brake lights will fix this and possibly save thousands of dollars of car repairs. European car companies have already started to look into an extra brake warning, but this solution would not work in North America because it is too similar to our red flashing turning signals. Colored brake lights can be the equivalent of this in North America, If colored brake lights are implemented they can save hundreds of lives and reduce rear-end accidents across the continent. This information has countless real world applications and can help improve car and road systems across the country. I hope the information found in this experiment is the start of multiple studies of colored brake lights and encourages more people to look into better solutions for car braking systems.
Sources Of Error
I understand the limitations of the chosen materials and method if I had unlimited time and resources I would have been able to test a wider range of participants with different ages and driving levels. I could have been able to see how different people would react if they were in different environments, bettering the results. I understand that the project was done at an etiquette grade 8 level. Someone who has a higher level of experience and with access to more resources could have made a full car simulation that included a gas pedal and steering wheel. They could test if people react differently when they are in a more car-like environment. My project was done at an efficient and effective grade 8 level and was done to the best of my abilities.
Citations
ELEGOO UNO Project Super Starter Kit Tutorial – ELEGOO Official
https://thenewswheel.com/the-history-of-bra
https://beckerlaw.com/blog/2-5-million-rear-end-collisions-every-year-make-common-type-crash/
https://aica.com/what-is-the-cause-of-most-rear-end-collisions/
https://vehiclefreak.com/do-brake-lights-have-to-be-red/
https://www.theautopian.com/emergency-stop-signals-are-the-cheap-safety-feature-you-never-knew-you-needed-but-american-legislators-are-blocking-the-best-of-these-lights/ ke-lights/#:~:text=By%201928%2C%2011%20states%20in,illuminated%20like%20they%20are%20now
Acknowledgement
I would like to thank our science fair coordinator Mrs. Watson who helped us along the way with my project. I would also like to thank my Grade 7 science teacher Mrs. Redwood, who took time to review my work and better my project. I would also like to acknowledge my family who helped me come up with a project and are always supportive. I would like to thank every single person who took time out of their day to help me test my project. And finally I would like to acknowledge my grandparents who helped inspire me to do a science fair project.