identifying marine microplastic hotspots and their ecological risk to endangered species using geospatial analysis!
Anika Rastogi
Westmount Mid/High School
Grade 11
Presentation
Problem
problem
Millions of tons of plastic float in the ocean every year. This is called plastic pollution. And slowly they break down and become something called microplastics. Many species like turtles, seabirds, fish, and dolphins are at risk from microplastics; they either ingest the microplastics or ingest something that has. Which soon becomes a danger to us as humans. This leads me to my Question: Does plastic influence where these specific species travel or migrate?
Method
METHOD(outline)
1.0 methodology
1.1 abstract
This project builds an interactive map that shows animals' migration patterns and global microplastics pollution to see if there are certain animals, in this case, blue whales, bottlenose dolphins, and green sea turtles, that change the way they migrate or reside around the world.
I will be creating a website that allows people to track real-life data from over many years with plastic pollution heat maps, data found from real studies. which in turn lets users explore this connection visually. This website allows us to view data from the past year all the way back to 1970, showing where animals reside yearly, and gives us a zoom in and out function to observe the spatial overlap between these species. This tool can aid researchers and conservation groups in understanding and visualizing the potential impacts of microplastic pollution on marine animals.
1.2 board views
Millions of tons of plastic pollution enter the world's shores and oceans yearly. Although we have the data individually on both marine animal and microplastics movement, there's no simple way to compare this data side by side. The goal of this project is to fill in the gap by creating a website that is a tool that visually compares these datasets. By viewing this information in a clear and understandable map, this allows users and judges can visually notice the relationship between animals and plastics.
1.3 ecological and biological background
Animals migrate for multiple reasons, including food, breeding, climate change, and many more. Pollution may affectthe feeding and the survival of this species. I decided to focus on sea turtles, blue whales, and bottlenose dolphins.
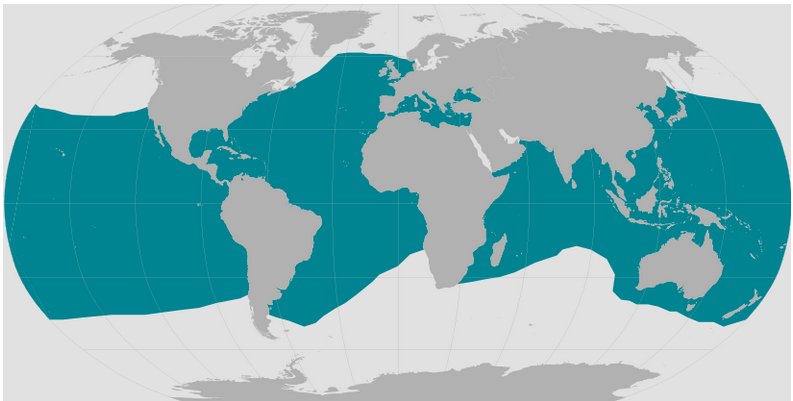
Green sea turtles have one of the largest habitat ranges in the entire world, nesting in approximately 80 countries and traveling through the waters of 140 countries. Their migration patterns are highly complex; adults typically migrate every 2-5 years from different shorelines back to the place where they initially hatched.
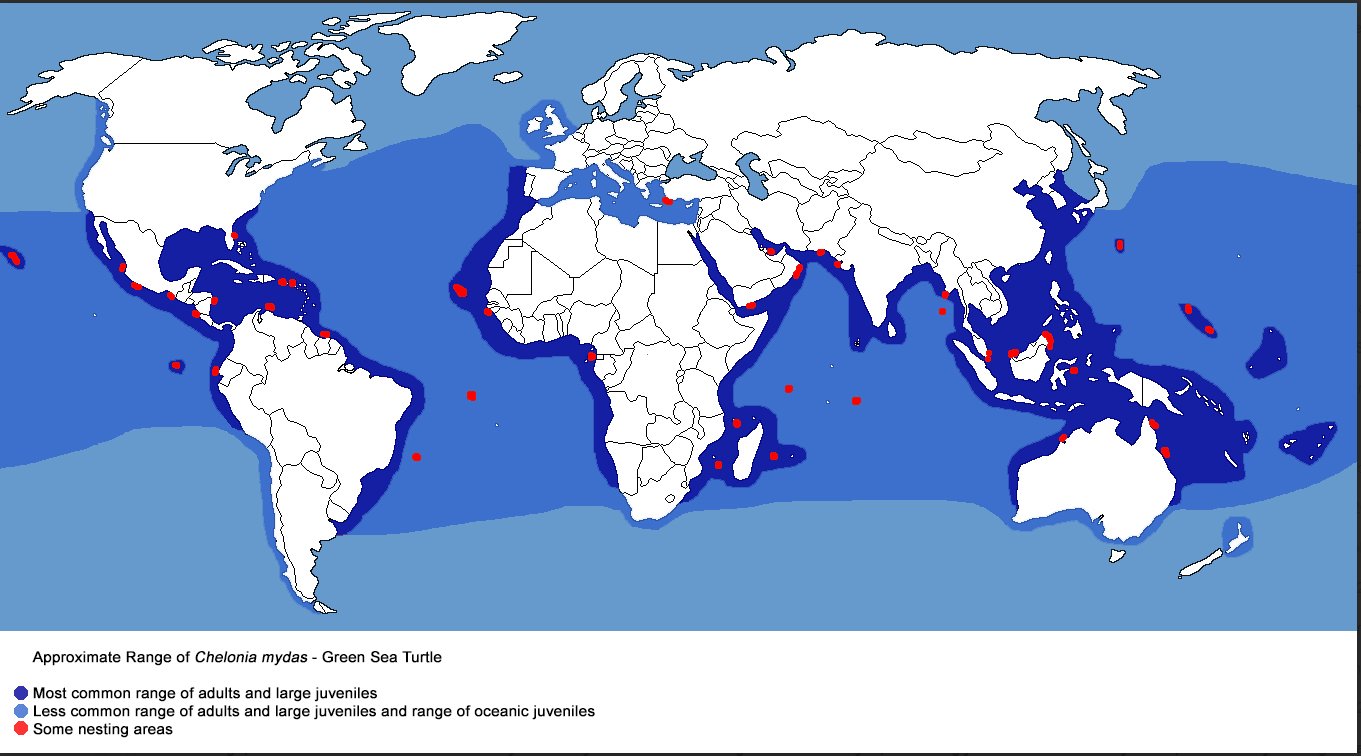
These migrations can reach from hundreds of thousands of kilometers across the entire ocean. Green sea turtles highly rely geomagnetic fields for navigation, using it as a GPS (global positioning system) to determine where in the ocean the turtle is, relative to the latitude and longitude, guiding them through the ocean, Since seawater conducts electricity, it interacts with the magnetic field, allowing turtles to sense the geomagnetic changes as they travel. Green turtles feed in globally significant areas such as the Great Barrier Reef, Shark Bay in Australia, the East China Sea, and the Red Sea. At the beginning of the sea turtle's lifetime, hatchlings usually feed on drifting oceanic life, but as they grow older, their diet starts turning into a more herbivorous diet. Their breeding is very widespread and includes major sites like Tortuguero in Costa Rica, Colota Beach in Mexico, and Raine Island in Australia, along with many other locations through the Atlantic, Caribbean, and Florida. At the moment, sea turtles are listed as of least concern, but their population sizes are slowly decreasing. The reason I chose a turtle is that it is a well-known fact that turtles follow sea currents, which are the same currents plastic flows in. Therefore turtle are especially vulnerable to microplastic pollution because they might resemble their natural food source, causing ingestion. Turtles may also accidentally consume plastics mixed with microplastics cause intestinal blockage, internal injuries, and increased mortality.
Bottlenose dolphins have a wide habitat range that includes coastal water, bays, and offshore regions, based on two regions. They generally fall into two groups: coastal (inshore) and offshore dolphins.
Coastal dolphins remain close to shore, usually within five miles of the coastlines, and are slimmer and usually reach up to 8feet in length. They often hunt in seagrass and sandy coastal environments. Offshore dolphins are usually larger, reaching up to 14 feet, andweighing nearly 1,000 pounds. Their darker coloration and body structure allow them to live in colder environments. Offshore dolphins typically follow prey and may be either migratory or non-migratory.
Non-migratory dolphins travel about 24 kilometers per day, while migrating dolphins can travel over 32 kilometers per day, with some exceeding 50 kilometers per day, depending on prey movement. Bottlenose dolphins feed primarily in estuaries, bays, and near-shore waters using specialized techniques. They do not have a single breeding area, and they reproduce across a much longer area. Although their conservation status is currently listed as least concern, dolphins can ingest microplastics directly or indirectly through prey, which may lead to internal injuries, chemical exposure, and starvation due to blockage.
Blue whales are the largest animals to have ever lived on earth, reaching up to a length of 30 metres(100 feet) and weighing as much as 180,000 kilograms ( 400,000 lbs). To put that into comparison, their tongue can weigh as much as an elephant, and their heart can weigh up to a small car. Even with their immense size and length, they still face significant threats from humans. They rely on tiny prey like kirill for food, so even the smallest microplastics can affect them, including microplastic pollution, climate change, and shipping traffic, which can have serious impacts on their well-being**.**
1.4 technology
To develop the project, I use several tools and technologies, which are:
- Python to clean, process, and merge a large dataset
- CSV and GeoJSON files store and display animal migration and species tracking data
- Global plastics pollution databases to generate plastic density heat map layers.
- Web-map-based mapping, using Leaflet, Mapbox, or Streamlit map for interactive visualization.
technical approach; The main idea is layer stacking, in which multiple datasets are displayed together on a single map. This allows users to visually compare different information at the same time.
Map layer includes:
- Plastic pollution density (heat map)
- species migration and sighting data (points and paths)
1.5 knowledge gap
Currently, large datasets exist for both marine animal migration and plastic pollution, but these datasets are usually stored and analyzed separately.
- species tracking data exists as points,
- plastic pollution exists as density maps
Purpose: Projects aim to close the gap by creating a website that helps users observe whether marine animals move through or avoid plastics.
2.0 development
2.1 Research Questions
-> Does plastic pollution change where these species travel? -> Do they avoid areas with high pollution zones or pass through them?
2.2 data & processing
- collect animal tracking and migration datasets
- obtain global plastic pollution maps
-
clean the datasets to retain
-
latitude
- longitude
- data
- species
4. Merge datasets into a single format 5. Export cleaned datasets into map-ready layers.
2.3 Building the map
steps include: -> set up base map -> add species tracking layer -> add plastic heat map -> add filtering tools -> add pop-ups with simple species info -> add legend + instructions
2.4 conclusion
Analysis
Analysis:
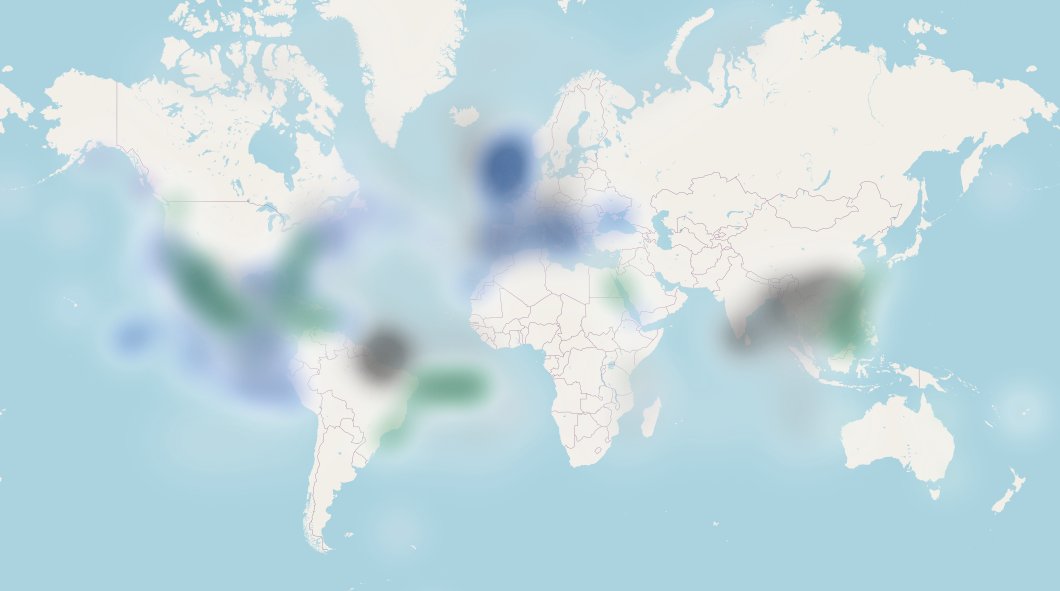
A comparison of our microplastic disturbance maps from 2005 to 2020 reveals a relationship between the spread of microplastic pollution and marine animal migration patterns. While the migration of marine animals such as blue whales, bottlenose dolphins, and green sea turtles remains relatively the same over time, the intensity of microplastic pollution has increased greatly over the years, leading to an overlap of these species' populations.
In 2005, mircoplastics seem to be closer to the shoreline and less intense, primarily concentrated in oceans like the North Pacific, indian oceans, and parts of the Atlantic. During this time, many animal migration routes pass near or through these areas, but the overlap between these layers are minimally. This shows that even though marine animals were exposed to microplastics, the exposure was less.
In 2020, the situation changed noticeably. Microplastic pollution becomes far more widespread and much more noticeable. These polluted areas expand to regions that were less affected, include feeding grounds of these species.
This growing overlap is significant because marine animals don't seem to change there pattterns in response to the pollution. The species I research relies on long establish pathway. As microplastics spread into these pathways, animals are more exposed to plastic particles through ingestion, respiration, and contact with contaminated water and prey. Over time, this can lead to something called bioaccumulation, where the plastics can start with a tiny fish and slowly but surely build up within a food chain, potentially affecting animals' health, reproducation and more.
Maps show that regions with high human activity and major ocean currents have the greatest microplastic concentration. Ocean currents trap debris, concrtating there in more biologically important places.
Looking at the maps from 2005 to 2020, it's clear that microplastic pollution has grown faster than the oceans can absorb. Many migration routes of whales, dolphins, and turtles now cross the heavily polluted areas. These overlaps make it obvious that these animals are at high risk than we thought, and it highlights the need for better conservation.
2005 map vs 2020 ( example years for references towards the analysis)
2005 visual map:
2020 map: change map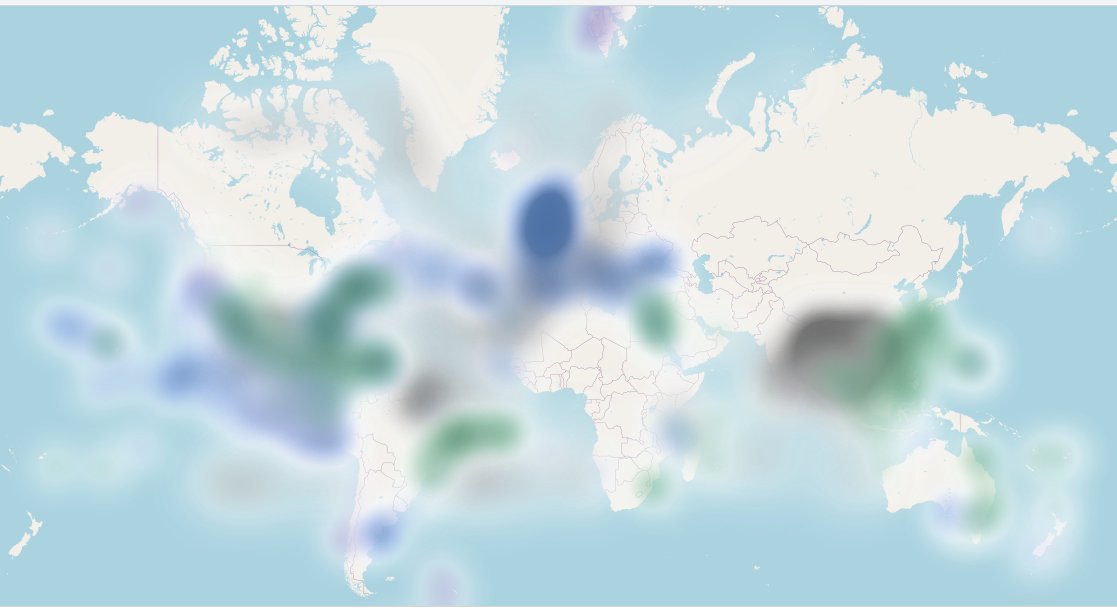
Conclusion
In conclusion, the geospatial analysis of microplastics and marine animal migration shows that near this time period, plastic pollution is increasing rapidly and overlaps significantly with the pathways of these species (blue whale, bottlenose dolphins, and green sea turtle). Despite the growth of microplastics, these animals continue to follow the long-established migration patterns, increasing their risk of exposure to microplastics. This overlap depicts the need for more data analysis and, visually, to inform conservation and policy decisions.
Citations
Works Cited
Fei, Fan, et al. “Effect of Static Magnetic Field on Marine Mollusc Elysia Leucolegnote.” Frontiers in Molecular Biosciences, vol. 9, 10 Jan. 2023, https://doi.org/10.3389/fmolb.2022.1103648. Accessed 17 Feb. 2024.
“Green Sea Turtle - Chelonia Mydas.” Californiaherps.com, 2018, californiaherps.com/noncal/baja/bajaturtles/pages/c.mydas.html. “Green Turtle (Chelonia Mydas) - DCCEEW.” Dcceew.gov.au, 2022, www.dcceew.gov.au/environment/marine/marine-species/marine-turtles/green. Igini, Martina. “Green Sea Turtles No Longer Endangered in Conservation Win.” Earth.org, 21 Oct. 2025, earth.org/green-sea-turtles-no-longer-endangered-species-in-major-conservation-win/. Johanna. “Sea Turtle Migration Patterns: Navigating the Ocean’s Vastness - the Happy Turtle Straw.” The Happy Turtle Straw, 5 Aug. 2024, www.thehappyturtlestraw.com/sea-turtle-migration-patterns-navigating-the-oceans-vastness/. NOAA Fisheries. “Common Bottlenose Dolphin.” Noaa.gov, 15 Sept. 2022, www.fisheries.noaa.gov/species/common-bottlenose-dolphin. ---. “Green Turtle.” Noaa.gov, 2025, www.fisheries.noaa.gov/species/green-turtle. ---. “Green Turtle.” Noaa.gov, 2025, www.fisheries.noaa.gov/species/green-turtle. Radcliff, Matthew R, and Brian Monroe. “Ocean Tides and Magnetic Fields.” NASA Scientific Visualization Studio, 12 Dec. 2016, svs.gsfc.nasa.gov/12450/. SEE Turtles. “SEE Turtles.” SEE Turtles, 2014, www.seeturtles.org/sea-turtle-migration. Slimak, Nadine. “Dolphins and Plastics - Sarasota Dolphin Research Program.” Sarasota Dolphin Research Program, 27 Jan. 2025, sarasotadolphin.org/dolphins-and-plastics/. SWOT. “The State of the World’s Sea Turtles | SWOT.” The State of the World’s Sea Turtles | SWOT, 2014, www.seaturtlestatus.org/sea-turtles-plastic-pollution. The Migration Route of the Bottlenose Dolphin - Sunshine Scenic Tours. 29 Dec. 2022, boattoursjohnspass.com/the-migration-route-of-the-bottlenose-dolphin/. Yong, Ed. “Turtles Use the Earth’s Magnetic Field as a Global GPS.” Science, 24 Feb. 2011, www.nationalgeographic.com/science/article/turtles-use-the-earths-magnetic-field-as-a-global-gps.
Disclaimer: Use AI to generate websites, and use it to help troubleshoot my code (give me advice)
Acknowledgement
I acknowledge my family members who supported me through this project, as well as Ms. Lai and the judges from my school science fair who gave me this opportunity.