Coating Parameters of the Catalyst Ink and Their Impact on PEMFC Performance
Grade 11
Presentation
Hypothesis
If the ratio of isopropyl alcohol (IPA) to water in the catalyst ink solvent is increased, then the size of the aggregates in the catalyst ink will decrease, leading to improved catalyst layer coverage and reduced ionic resistance. This is because a higher concentration of isopropyl alcohol allows particles to spread uniformly across the catalyst surface and promotes better interactions with the membrane.
Research
The global transition to renewable energy has recently accelerated significantly due to growing concerns about climate change, energy security, and the impacts of fossil fuel use. Fossil fuels such as coal, oil, and natural gas account for over 75% of global greenhouse gas emissions and almost 90% of carbon dioxide emissions globally (United Nations, n.d.). Processes that require the burning of fossil fuels, such as generating power and manufacturing goods, are key causes of greenhouse gas emissions. The greenhouse effect is the primary driver of climate change, and human activities are responsible for increasing the concentration of greenhouse gases released into the atmosphere (Causes of Climate Change, n.d.). As a result of the increasing carbon emissions, 196 countries signed the Paris Agreement, which aims to limit global warming to 1.5°C by the year 2050 (The Paris Agreement, n.d.). Each country that signed onto the Paris Agreement proposed commitments to reduce emissions. Some examples of these commitments include the European Union reducing emissions through domestic measures and India increasing electric power from non-fossil fuel energy resources (The Paris Agreement on Climate Change, n.d.).
In the United States, three economic sectors — transportation, electric power, and industry — contribute to over 75% of all greenhouse gas emissions (Us Epa, 2015). Transportation is the largest sector, making up 28% of all greenhouse gas emissions because petroleum-based fuels are most commonly used for transportation (Us Epa, 2015). In Canada, oil and gas, transportation, and buildings are the top three economic sectors contributing to over 60% of emissions in the country (Share of Greenhouse Gas Emissions in Canada 2023, by Sector, n.d.). Therefore, a significant reduction in overall greenhouse gas emissions can be achieved by limiting the emissions from the transportation sector (Baroutaji et al., 2016). This has led to the adoption of clean energy sources and clean energy transportation solutions. Accordingly, there has been a global push for zero-emission vehicles, including battery-electric and hydrogen-fuel cell-powered vehicles (Baroutaji et al., 2016).
Both electric batteries and proton-exchange membrane fuel cells (PEMFCs) are promising alternatives to internal combustion engines due to their efficiency and environmental benefits. The application focus of PEMFCs is no longer on light-duty vehicles due to the fact that electric vehicles (EVs) have been around for longer, the cost of EVs is significantly lower than PEMFC-powered vehicles in consideration to small vehicles, and charging infrastructure has been expanded (Cullen et al., 2021). However, because all the energy is stored in batteries, for long-distance heavy-duty vehicles (e.g., trucks), the weight of the battery required for long operations is a huge limitation. Thus, there has been immense interest in PEMFCs' zero-emissions power source for heavy-duty vehicles. For heavy-duty vehicle applications, a key technological challenge is improving the durability of PEMFCs (Cullen et al., 2021), (Meeting, n.d.). Hydrogen-powered PEMFCs were simulated in heavy-duty vehicles, and a study found that the metrics used to determine performance standards were not only met but also exceeded (Ogungbemi et al., 2021), showing great promise in the use of PEMFCs in the transportation sector.
In a PEMFC, hydrogen and oxygen are supplied into flow channels, gas diffusion layers (GDLs), and the catalyst layer (CL) (Zhao et al., 2023). At the anode, hydrogen splits into protons and electrons through the hydrogen oxidation reaction (HOR). The electrons are transported through electron-conducting components, such as carbon paper. At the same time, protons are conducted through the ionic polymer (ionomer) in the anode catalyst layer through the polymer electrolyte membrane to the cathode catalyst layer. Protons are transported through the membrane to the catalyst layer while electrons travel through an external circuit, generating electricity as they move. At the cathode, oxygen reacts with the protons and electrons at the catalyst surface to produce water via the oxygen reduction reaction (ORR). The ORR is slower and more complex than the HOR, which limits the overall performance of the fuel cell. A simplified model of these processes has been described in the literature (Escobar-Yonoff et al., 2021), (Suter et al., 2021) and can be seen in Figure 1 and Figure 2. Over 40% of the total cost of mass-produced PEMFCs is attributed to the catalyst layer. To address this, researchers are exploring platinum alloys and alternative non-precious metal (NPM) catalysts to reduce platinum content without sacrificing performance. However, while NPM catalysts are more cost-effective, they are not as efficient or durable as CLs made with platinum, resulting in more frequent replacements that increase long-term costs (Zhao et al., 2023). Thus, in the near term, the PEMFC technology is expected to continue to use platinum-based catalysts.

Figure 1. Schematic depiction of a PEM electrolyzer and fuel cell: The fuel cell combines hydrogen and oxygen to produce electricity and water (Escobar-Yonoff et al., 2021).

Figure 2. Schematic depiction of a PEMFC showing the different layers, compositions, and reactant transport pathways (Suter et al., 2021). Black structures are the carbon supports, purple represents the ionomer, red is the polytetrafluoroethylene (PTFE), and green is the catalysts. Note the figure is not drawn to scale, and the catalyst layer, GDL, and MPL have different porosities and support material sizes.
Since performance and durability are higher-priority challenges for PEMFC application in heavy-duty vehicles, current efforts are directed to the catalyst layer (CL) design with the aim of both reducing the use of platinum and improving the CL structure (Zhao et al., 2023). The catalyst layer structure is very important because it impacts the fuel cell's short- and long-term performance. For the PEMFC to perform effectively, the catalyst layer must facilitate the efficient transport of the reactants (oxygen or hydrogen, protons, and electrons) of the electrochemical reactions, as well as the removal of product water and heat. The CL structure must have sufficient porosity and large pores for easy transport of oxygen gas in the cathode catalyst layer and hydrogen gas in the anode catalyst layer. The catalyst layer must have a well-connected network of ionomer coating the catalyst to ensure protons can reach the reaction sites for electrochemical reactions to occur. The catalyst layer must have enough ionomer to ensure ionic connectivity but not too much to isolate the catalyst/carbon-support particles electronically. The catalyst layer structure is controlled by the catalyst ink formulation as well as the catalyst ink coating method for the fabrication of the catalyst layer (Zhao et al., 2023).
The formulation of the catalyst ink plays a crucial role in enhancing the performance and durability of PEMFCs (Van Cleve et al., 2019). Figure 3 below shows the workflow from constituent materials to the final catalyst layer formation (Guo et al., 2020). The catalyst layer constituent materials, the catalyst and ionomer, are added to a solvent, which is typically a mixture of water and alcohol. The complex mixture is homogenized by mixing using ultrasonic and ball milling to make a uniform suspension called the catalyst ink. The ink is sprayed on a substrate made of a Teflon-like material known as polytetrafluoroethylene (PTFE), and upon evaporation of the solvent, the catalyst and ionomer create a nanoporous composite catalyst structure (Guo et al., 2020).
Figure 3. Schematic depiction of the process of creating the catalyst ink and fabricating the catalyst layer from the catalyst ink (Guo et al., 2020). Materials, including the ionomer, catalyst, and solvent, are combined and mixed in a dispersion step. The resulting catalyst ink is deposited onto a substrate — the catalyst layer forms on the substrate to be used in fuel cells.

It has been discovered that adjusting the ratio between water and isopropyl alcohol in the catalyst ink allows researchers to improve the viscosity of the ink, which may be important for spray deposition of the ink onto the substrate and adhesion of catalyst-ionomer aggregates to the substrate (Van Cleve et al., 2019). The size of the catalyst-ionomer aggregates in the ink can control the pores in the final catalyst layer structure. The ratio of ionomer and catalyst can control whether all catalysts are effectively utilized by providing protonic access. The link between catalyst ink properties and the final catalyst layer structure is not currently well understood. As a result, there is a lack of a rational approach to designing the optimum catalyst layer structure that yields high performance (Van Cleve et al., 2019).
New research on ink composition and application methods aims to maximize the total utilization of the catalyst while also balancing durability and reactant transport (Van Cleve et al., 2019). This contributes to the development of PEMFCs for commercial applications, especially in the heavy-duty vehicle sector (Van Cleve et al., 2019).
Variables
Independent Variable:
- The ratio of isopropyl alcohol in the water-isopropyl alcohol solvent mixture used to disperse the ionomer and catalyst in the catalyst ink
- wt.%: 10, 15, 25, 40, 50, 60, 80, 90
Responding Variables:
- Catalyst ink properties: catalyst-ionomer aggregate size, viscosity
- Catalyst layer properties: pore size, electronic resistance.
Controlled Variables
- The concentration of other components (ionomer and catalyst) in the catalyst ink.
- The thickness of the catalyst layer.
Procedure
This diagram shows the flow of the methodology used to conduct these experiments. As outlined, the first step is the preparation of the catalyst ink. Following the preparation of the ink, the three properties of average particle size, electrical conductivity, and Barrett-Joyner-Halenda average pore width were measured. These properties are outlined in the variables section. The procedures are described in further detail below the figure.
To investigate the effect of solvent composition on catalyst ink and catalyst layer (CL) properties, the ratio of isopropyl alcohol (IPA) in the water-IPA alcohol solvent mixture used to disperse the ionomer and catalyst in the catalyst ink was varied in 5% increments. The properties of the catalyst ink and the CL were measured and analyzed using various instruments for each water-to-IPA ratio. To ensure that the changes in these properties were solely due to the water-to-IPA ratio in the catalyst ink, many key factors were kept constant: the concentration of ionomer and catalyst in the catalyst ink, the environmental temperature (maintained at 20°C and 22°C), the thickness of the CL (10-20 µm), the application technique of the catalyst ink (slot die coating), and the mixing technique of the catalyst ink (ultrasonication and ball milling).
This study will follow the procedure described in sources (Islam et al., 2022) and (Poojary et al., 2020). A brief explanation of the methodology is as follows.
Preparation of the Catalyst Ink:
The first step that was completed was the preparation of the carbon ionomer dispersion catalyst ink. Different inks were prepared by mixing carbon black (Vulcan XC-72, Cabot Corp., Massachusetts) with a surface area of 223m2/g (Khan et al., n.d.), water, a mix of isopropyl alcohol (IPA) (Sigma Aldrich, Missouri), and deionized water in known ratios, which acted as the dispersion media. A 20 wt% Nafion ionomer dispersion (Nafion, Ion Power Inc., Delaware) was used to control the water content in the ink. Both the target ionomer-to-carbon ratio (I/C) of 0.8 and a solid-to-liquid (S/L) ratio of 0.05 were maintained while preparing the catalyst ink for all dispersions. Before using the Nafion ionomer, it was homogenized for 24 hours at room temperature, and that homogenization was followed by 30 minutes of sonication. Following this, the components of the ink were added in a set order: carbon first, then water, followed by IPA, and ending with the Nafion ionomer. The mixture was then probe-sonicated for a total of two minutes in four-second on/off cycles. After that, 16.5g of zirconia balls were added to the vial for every 200mg of carbon in the ink. The vial was sealed to prevent evaporation of the solvent and mixed on a roller mixer at 70 rpm for 15 hours.
Average Particle Size:
Following the preparation of the catalyst ink, its average particle size was determined using the dynamic light scattering (DLS) instrument (Zetasizer Nano ZS, Malvern Panalytical, UK), which measured the Brownian motion of particles in a dispersion (Panalytical, 2019). Brownian motion is the random movement of particles that results from their collisions with solvent molecules, such as water. DLS quantified this movement of particles using the translational diffusion coefficient (D) and calculated the hydrodynamic size – the size of a sphere that diffused at the same rate as the particle being measured, including anything bound to the surface of the particle (ions, absorbed polymers, etc.).
When a laser beam is directed at the ink sample, the particles scatter light, and due to the dynamic nature of the sample, the intensity of light scattered by the particles fluctuates over time. Autocorrelation tracked these fluctuations by comparing the intensity signals at different time intervals to determine how long it took for the signal to lose all correlation with the original signal. From this, the translational diffusion coefficient was determined to be used in the Stokes-Einstein equation, which relates the diffusion coefficient to the particle size, temperature, and viscosity of the solvent. The Stokes-Einstein equation can be seen below where dH is the hydrodynamic diameter (nanometers), k is Boltzmann’s constant (joules/Kelvin), T is the absolute temperature (Kelvin), η is viscosity (pascal-seconds), and D is the diffusion coefficient (meters squared per second). The Malvern Panalytical DLS can measure particle size distribution down to the nanometer scale, which makes this technique useful in applications such as the formulation of catalyst ink for proton-exchange membrane fuel cells (Panalytical, 2019). Each ink sample underwent three trials using the Malvern Panlytical DLS system and calculations using the Stokes-Einstein equation and the results were averaged to determine the average particle size of each ink sample.
Stokes-Einstein equation:

Electrical Conductivity:
After the catalyst ink was deposited onto the Teflon substrate and dried in a vacuum oven at 60°C overnight to allow the solvent to evaporate to create the CL structure, the electrical conductivity of the layer was determined. To do this, the electrical resistance first needed to be determined using a two-probe multimeter (Fluke 177 True-RMS Digital Multimeter, Fluke, Washington). A small sample (2cm x 5cm) of the CL was cut, and its thickness was measured using calipers. The CL was deposited on a Teflon substrate 52 microns thick, so the thickness of the CL was found by subtracting the thickness of the Teflon substrate from the total thickness of the CL and the Teflon substrate. The process of finding the thickness of the CL was repeated in three different spots on the same sample. This is because the thickness at three different points of the sample may not be exactly the same since the sample may not be perfectly even, though a good sample should be. The average of the thicknesses of the CL was taken to be used in the electrical conductivity calculation.
To measure the resistance of the CL, the sample was placed face down on two copper strips, which are good conductors of electricity. The two probes of the multimeter were placed on either copper strip, and the multimeter returned the resistance of the CL. Once the electronic resistance of the layer was determined, the electrical conductivity (σ) was calculated using the formula below, where L is the thickness of the sample (microns), R is the resistance (ohms), and A is the area of the sample (centimeters squared). The measurements were repeated for three different cut samples from the same deposited catalyst layer, and the average of the calculated electrical conductivities was taken in order to determine the electrical conductivity of each ink sample.
Electrical conductivity:

Barrett-Joyner-Halenda (BJH) Average Pore Width:
The BJH average pore width of the CL was determined using nitrogen (N2)-sorption analysis. The dried deposited CL prepared to find the electrical conductivity was scratched into powder form. Approximately 120mg of this powder was used for analysis. To remove any absorbed moisture or gases, the sample of powder was degassed at 160°C for at least 12 hours. Nitrogen adsorption and desorption isotherms were collected at 77 Kelvin using a 3FlexTM analyzer (Alberta Sulphur Research Ltd., University of Calgary Research Center), with pressure varying from 1mmHG to 760mmHG. The sample’s porosity was determined using BET analysis to measure its nitrogen adsorption capacity. The pore size distribution was then determined using the Barrett-Joyner Halenda (BJH) method, which was used to analyze the pore size distribution of materials, focusing on mesopores (Dey et al., 2023). It used nitrogen adsorption and desorption of isotherms obtained from BET analysis, applying the Kelvin equation to convert pressure values into pore diameters. By looking at the desorption branch of the isotherm, the BJH method was used to calculate the pore width distribution. This is important for understanding the performance of the CL and helps track changes in pore structure (Dey et al., 2023). For each powder sample, this process was repeated three times, and the average was calculated in order to get the best representation of the BJH average pore width for each sample.
Graphs and Analysis:
In order to visually represent the data collected using the above procedures, Microsoft ExcelTM (Excel 2024) was used to create graphs. Three tables were then created where each property measured – average particle size, electrical conductivity, and BJH average pore width – was plotted against water content (wt.%) with water content as the manipulated variable and the property as the responding variable. Each table was then converted into a graph using Excel’s graphing tool. The average particle size was graphed on a bar graph, and error bars were added using the standard deviation formula below where is the standard deviation (nanometers), xi is the individual particle size measurements from the three trials (nanometers), x is the average particle size (nanometers), and n is the number of trials conducted. Both the electrical conductivity and the BJH average pore width were plotted on a discrete line graph. These visual representations made it easier to identify relationships between water content and each measured property. Examining the patterns in the data allows for the impact of solvent composition on catalyst ink and CL properties to be effectively evaluated.
Standard deviation:

Observations
The image below shows the instrument used to spread the catalyst ink into an even layer to create the catalyst layer.
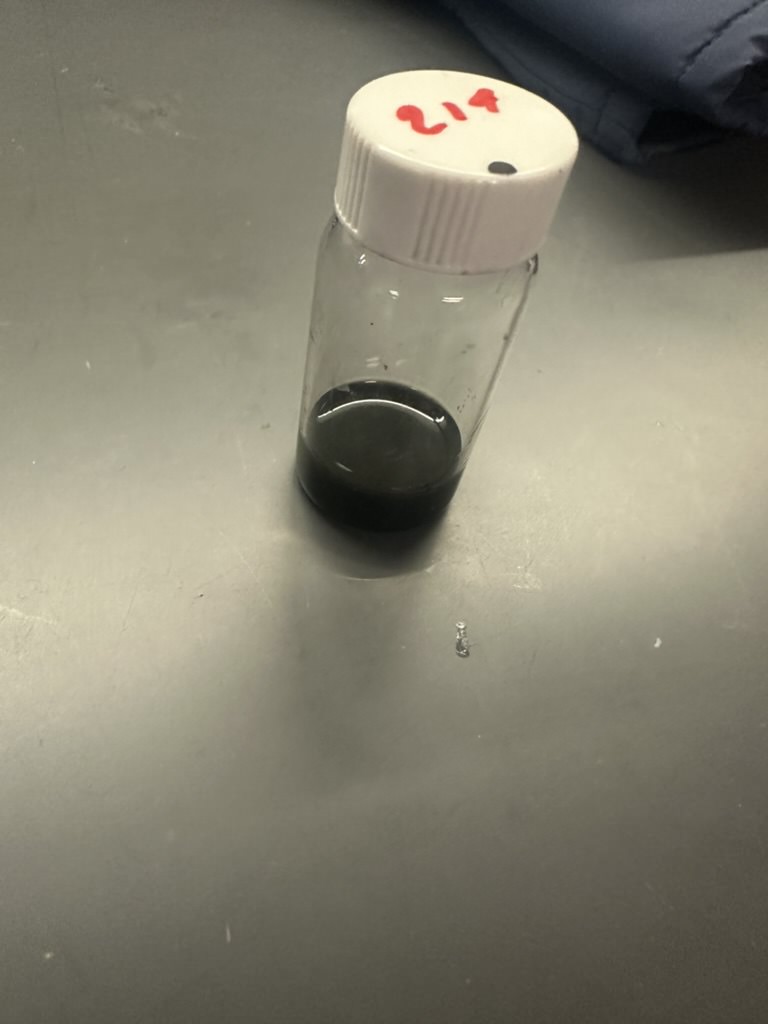
The image below shows the catalyst layer, which was prepared using catalyst ink that was dried to form the layer.
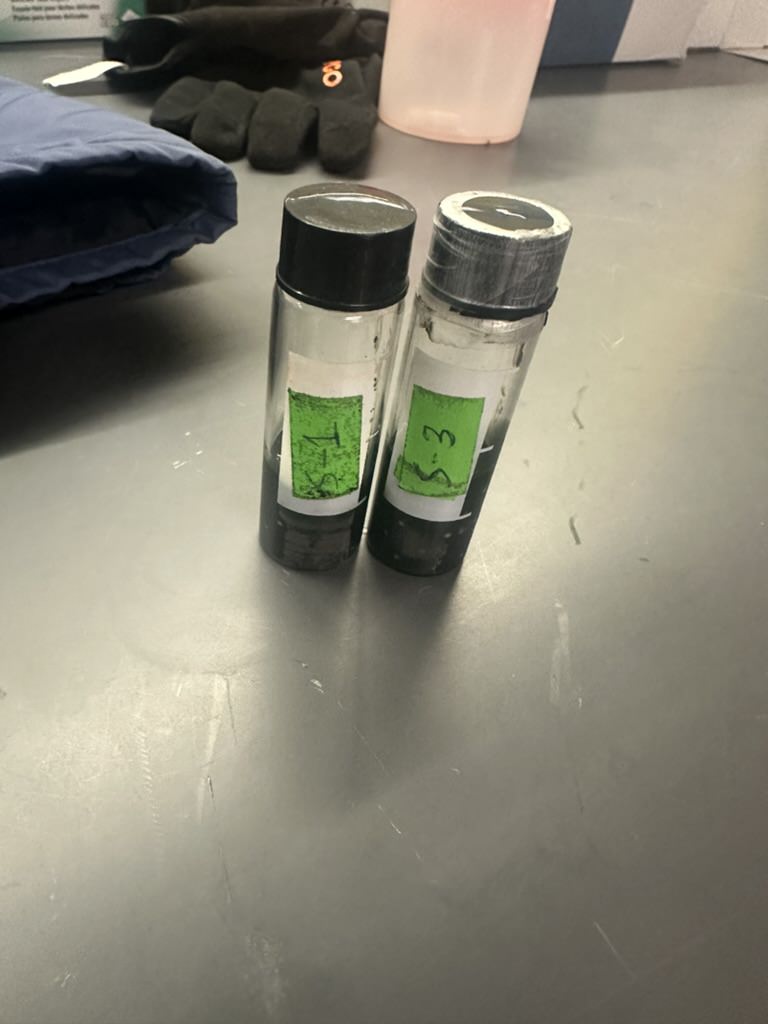
The following two images show the prepared catalyst ink after it had been fully dispersed.
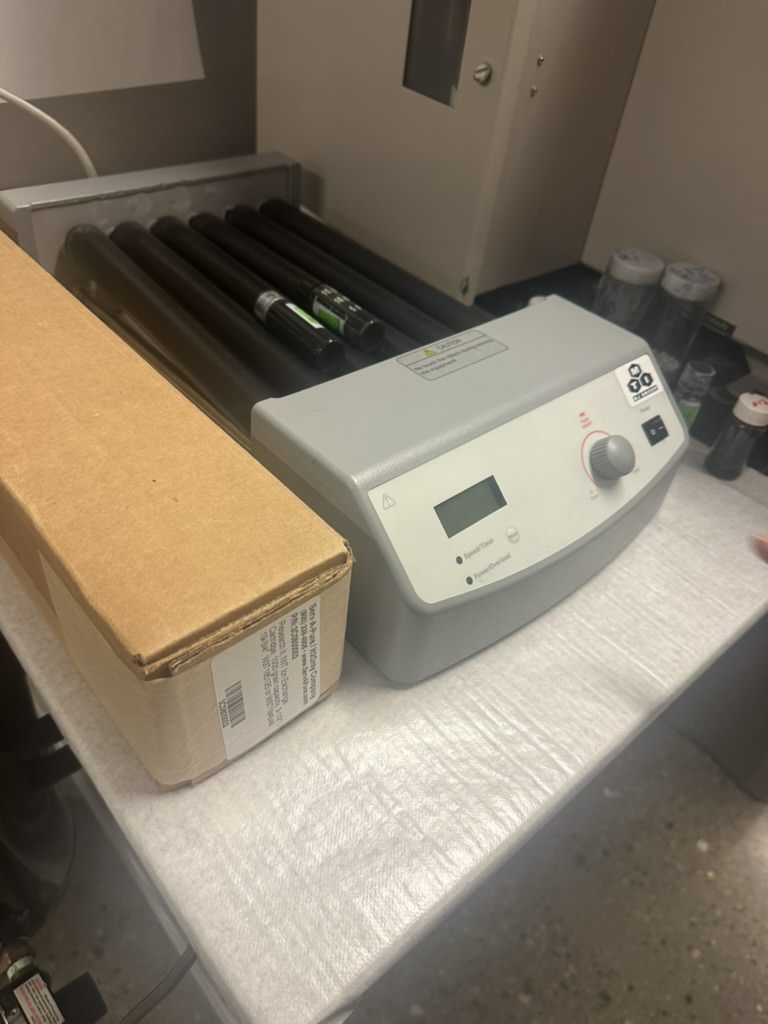
The image below shows the catalyst ink on the rolling mixer, which ensures that the catalyst ink is fully dispersed.
The image below shows the two-probe multimeter that was used to find the electronic resistance of the catalyst layer to then be used to find the electrical conductivity of the layer.

The image below shows the two-probe multimeter used to find the electrical resistance. The catalyst layer was placed face down on two copper strips which conduct electricity and the multimeter returned the electronic resistance.

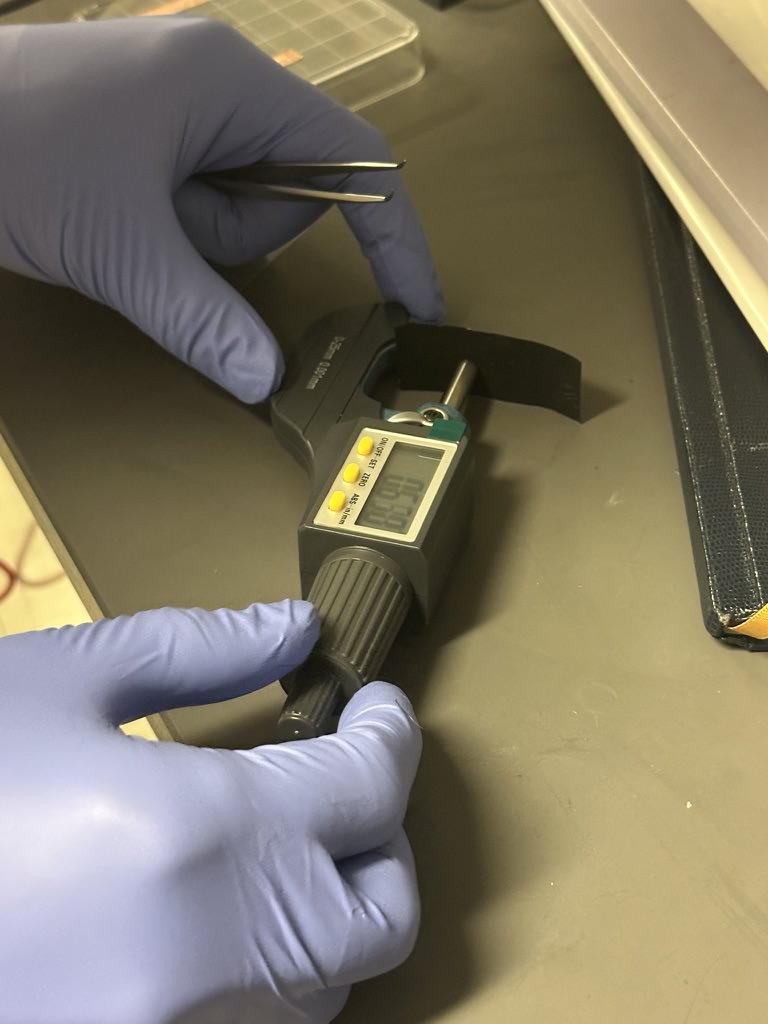
The image below shows the thickness of the catalyst layer being found using calipers. The thickness of the catalyst layer was found by taking the total thickness of the catalyst layer and the substrate, then subtracting the thickness of the substrate, which is a known value.
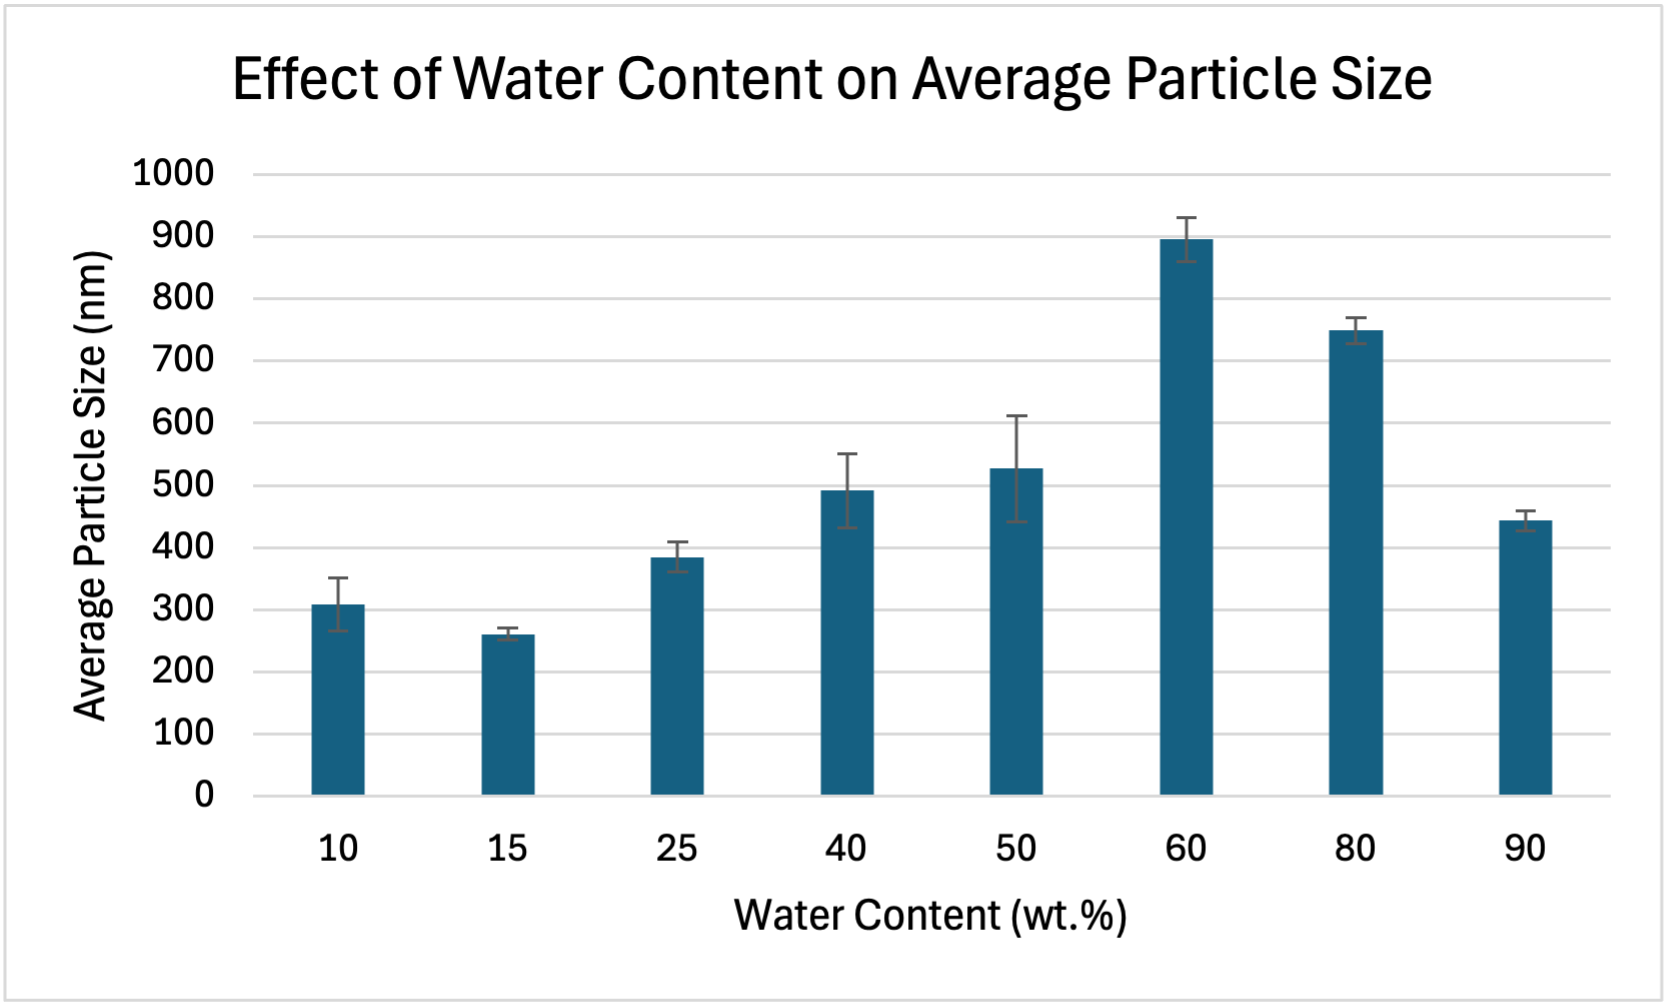
The table below shows the raw data collected, which shows the different average particle sizes of the catalyst ink for different water contents. The last column shows the error bar values, which were calculated using standard deviation.
| Water Content (wt.%) | Average Particle Size (nm) | Error Bars |
| 10 | 309.00 | 42.75156 |
| 15 | 261.00 | 9.1047 |
| 25 | 385.00 | 24.4205 |
| 40 | 492.00 | 59.69552 |
| 50 | 527.00 | 85.4321 |
| 60 | 896.00 | 35.19785 |
| 80 | 749.00 | 21.19399 |
| 90 | 443.00 | 16.09564 |
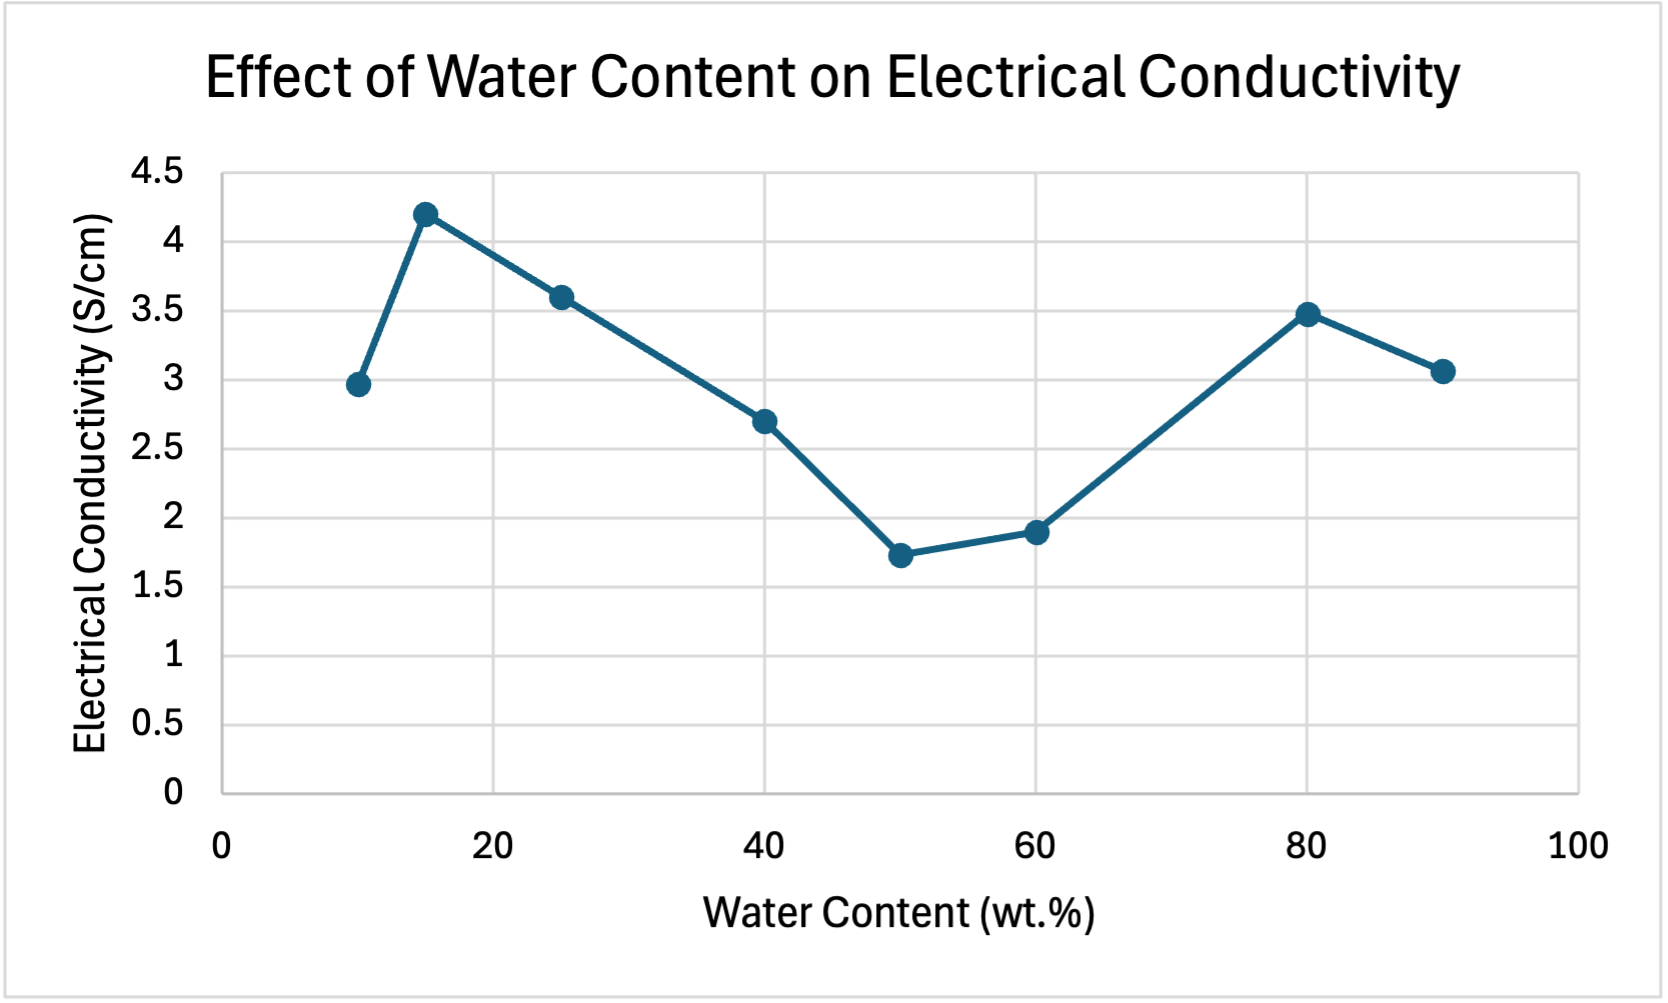
The table below shows the raw data collected, which shows the electrical conductivity of the catalyst layer at different water contents.
| Water Content (wt.%) | Electrical Conductivity (S/cm) |
| 10 | 2.97 |
| 15 | 4.20 |
| 25 | 3.60 |
| 40 | 2.70 |
| 50 | 1.73 |
| 60 | 1.90 |
| 80 | 3.48 |
| 90 | 3.06 |
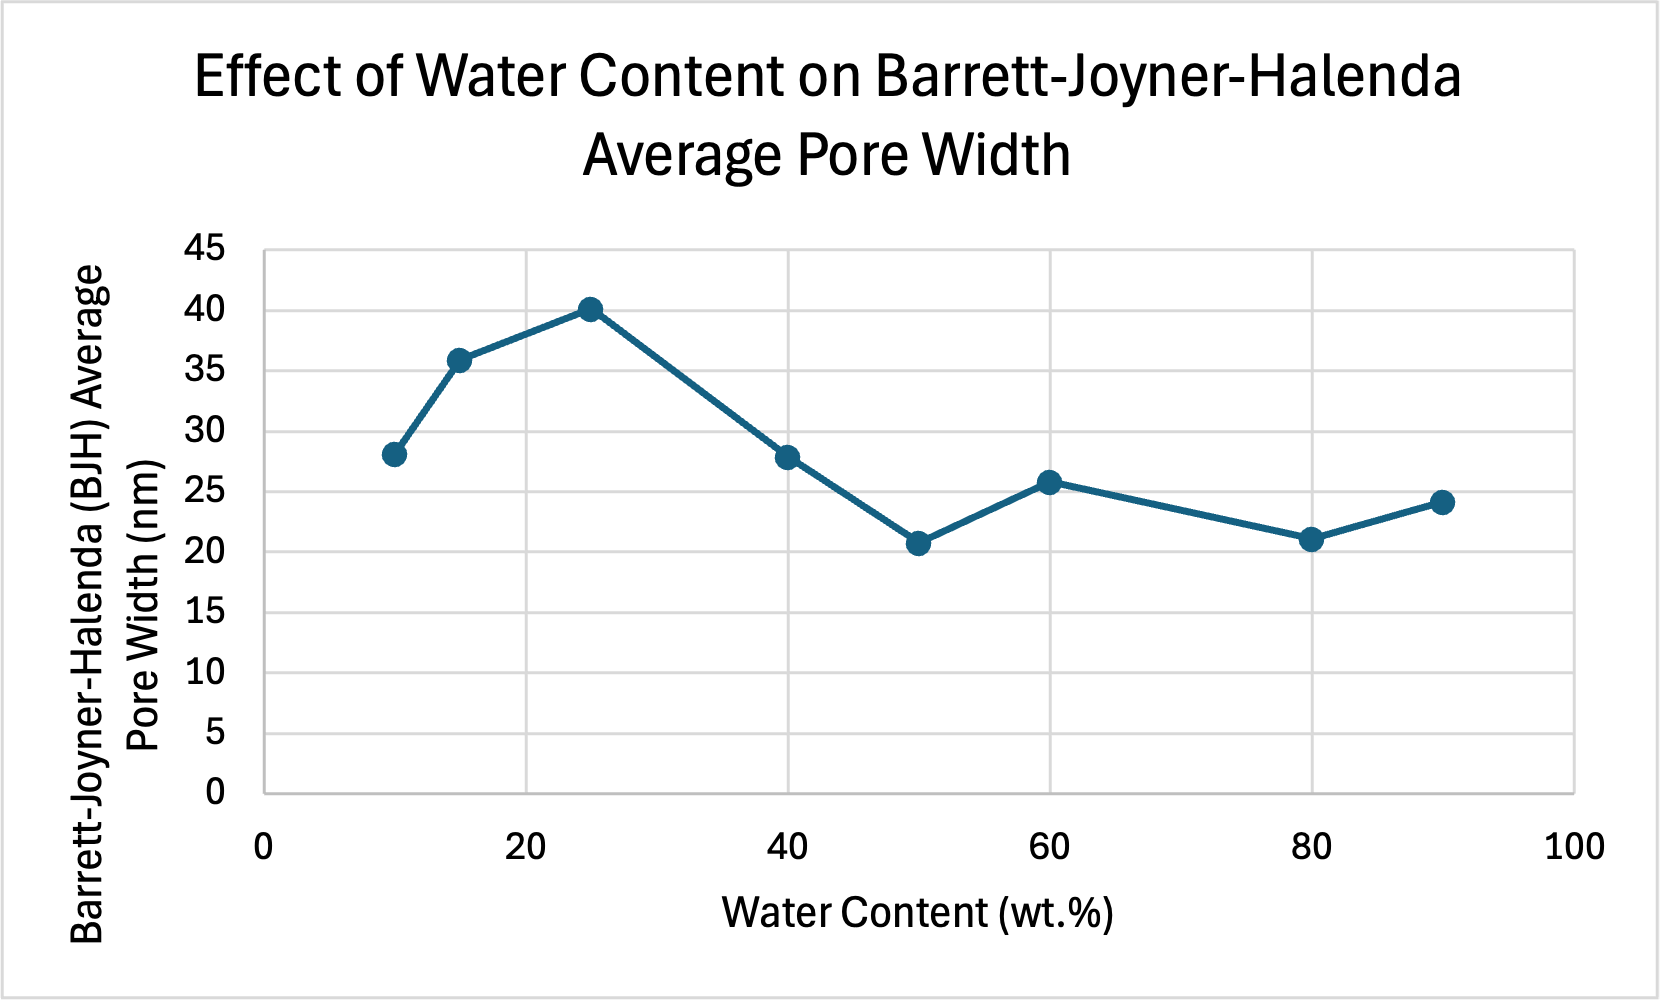
The table below shows the raw data collected, which shows the Barrett-Joyner-Halenda (BJH) Average Pore Width at different water contents.
| Water Content (wt.%) | Barrett-Joyner-Halenda (BJH) Average Pore Width (nm) |
| 10 | 28.18 |
| 15 | 35.90 |
| 25 | 40.14 |
| 40 | 27.90 |
| 50 | 20.78 |
| 60 | 25.80 |
| 80 | 21.12 |
| 90 | 24.15 |
Analysis
The graph below shows the effect of water content on average particle size. Smaller average particle size is better for catalytic activity as it creates a higher surface area-to-volume ratio, providing more sites for reactions (Xie et al., 2021). As seen in the graph below, the optimum water content in regards to average particle size is 15wt.% because this is where average particle size is the smallest.
The graph below shows the effect of water content on electrical conductivity. High electrical conductivity is conducive to an optimal PEMFC as it is indicative of efficient electron transport during reactions. This minimizes resistive losses, enhancing overall performance of a PEMFC (Xie et al., 2021). As seen in the graph below, electrical conductivity peaks at 15wt.%, indicating that this is the most optimal water content for electrical conductivity.
The graph below shows the effect of water content on Barrett-Joyner-Halenda (BJH) average pore width. Large BJH average pore width is important for an optimal PEMFC as gases need to have enough space to diffuse throughout the cell to facilitate reactions (Xie et al., 2021). As seen in the graph below, BJH average pore width peaks at 25wt.%, indicating that this is the most optimal water content for average pore width, however, average pore width is still relatively high at 15wt.% making this a viable option.
The analysis of the ratio of isopropyl alcohol (IPA) to water in the catalyst ink solvent composition highlights many key factors that influence its performance, including water content, particle size and pore width, electrical conductivity, and overall efficiency.
Water content plays a significant role in determining the particle size, pore structure, and conductivity of the ink. The non-linear trends observed in all three graphs above indicate a complex relationship between solvent composition and ink behavior.
Electrical conductivity is affected by water levels in the ink. When water levels are low to moderate, smaller particles are formed, enhancing the conductivity of the ink as ions can flow throughout the cell with greater ease. However, excessive amounts of water cause particles to aggregate, leading to decreased conductivity as ions are unable to efficiently move throughout the proton-exchange membrane fuel cell (PEMFC). Interestingly, the data suggests that at very high water contents (between 60wt.% and 80wt.%), particles seem to redisperse, resulting in an increase in conductivity once again.
Particle size and pore width also influence conductivity. Smaller particles and larger pores increase the overall conductivity of the catalyst layer, and well-structured porosity reduces ionic resistance within the cell.
Efficiency and overall performance are directly linked to conductivity and ion mobility. Higher conductivity and better ion mobility lead to increased efficiency, whereas poor dispersion and large particle aggregates create higher resistance, reducing the overall performance of a PEMFC.
Achieving an optimal balance between all three properties – particle size, average pore width, and electrical conductivity – is key for maximizing performance of a PEMFC.
Conclusion
The results indicate that electrical conductivity reaches its peak at 15 wt.% with a value of 4.20 S/cm. Additionally, the smallest average particle size, measuring 261nm, is also observed at the concentration of 15 wt.%. While the BJH average pore width is the highest at 25 wt.% (40.14 nm) the value at 15wt.% (25.90 nm) is still relatively high.
Based on these findings, 15wt.% appears to be the optimal concentration. It offers the highest electrical conductivity, which enhances ion transport. The smallest particle size at this concentration contributes to better catalytic performance. Furthermore, the relatively high pore width supports proper gas and water diffusion, making 15 wt.% the most favorable option.
Application
Developing efficient proton-exchange membrane fuel cells (PEMFCs) is incredibly important to advance sustainable energy alternatives. By enhancing durability, performance, and cost-effectiveness, this research supports the creation of PEMFCs for commercial applications, helping bridge the gap in the transition to renewable energy. One of the most significant applications of efficient fuel cells is in heavy-duty vehicles, which are among the largest contributors to greenhouse gas emissions. By improving fuel cell technology, these vehicles can transition away from using fossil fuels, reducing their ecological footprint.
Future work will focus on refining the water-to-isopropyl alcohol (IPA) ratio to determine the optimal ratio for catalyst ink formulation and establishing a set of manufacturing parameters for large-scale production of PEMFCs. As these advancements continue, PEMFCs have the potential to become more affordable and widely accessible. In the long term, once they reach cost-effectiveness, fuel cells can be used globally across various industries and in regions that do not have access to a reliable source of energy, providing a clean and sustainable power source to communities in need.
Sources Of Error
- Testing period: The performance of proton-exchange membrane fuel cell (PEMFC) electrodes may change over time due to issues like water poisoning, which occurs when the cell fails to efficiently remove excess water produced in the cathode. This buildup of water hinders electrochemical reactions, reducing the overall efficiency of the fuel cell. Testing for durability and degradation over extended periods would yield better results.
- Limited range of water content tested: The study focused on specific water content values as listed in the variables section. Expanding the range with finer intervals would allow for more precise optimization of the solvent to be used in the catalyst ink.
Citations
References
Baroutaji, A., Carton, J. G., Sajjia, M., & Olabi, A. G. (2016). Materials in PEM Fuel Cells. In Reference Module in Materials Science and Materials Engineering. Elsevier. https://doi.org/10.1016/b978-0-12-803581-8.04006-6
Causes of climate change. (n.d.). Climate Action. Retrieved October 14, 2024, from https://climate.ec.europa.eu/climate-change/causes-climate-change_en
Cullen, D. A., Neyerlin, K. C., Ahluwalia, R. K., Mukundan, R., More, K. L., Borup, R. L., Weber, A. Z., Myers, D. J., & Kusoglu, A. (2021). New roads and challenges for fuel cells in heavy-duty transportation. Nature Energy, 6(5), 462–474. https://doi.org/10.1038/s41560-021-00775-z
Dey, A., Varagnolo, S., Power, N. P., Vangapally, N., Elias, Y., Damptey, L., Jaato, B. N., Gopalan, S., Golrokhi, Z., Sonar, P., Selvaraj, V., Aurbach, D., & Krishnamurthy, S. (2023). Doped MXenes—A new paradigm in 2D systems: Synthesis, properties and applications. Progress in Materials Science, 139(101166), 101166. https://doi.org/10.1016/j.pmatsci.2023.101166
Escobar-Yonoff, R., Maestre-Cambronel, D., Charry, S., Rincón-Montenegro, A., & Portnoy, I. (2021). Performance assessment and economic perspectives of integrated PEM fuel cell and PEM electrolyzer for electric power generation. Heliyon, 7(3), e06506. https://doi.org/10.1016/j.heliyon.2021.e06506
Guo, Y., Pan, F., Chen, W., Ding, Z., Yang, D., Li, B., Ming, P., & Zhang, C. (2020). The controllable design of catalyst inks to enhance PEMFC performance: A review. Electrochemical Energy Reviews. https://doi.org/10.1007/s41918-020-00083-2
Islam, M. N., Mansoor Basha, A. B., Kollath, V. O., Soleymani, A. P., Jankovic, J., & Karan, K. (2022). Designing fuel cell catalyst support for superior catalytic activity and low mass-transport resistance. Nature Communications, 13(1), 6157. https://doi.org/10.1038/s41467-022-33892-8
Khan, A. S. A., Allwar, A., Nazzal, J. S.-, Narkiewicz, U., Morawski, A. W., & Michalkiewicz, B. (n.d.). Evaluation of BET surface area of Vulcan XC-72 carbon. Analysis parameters: ResearchGate. Retrieved February 17, 2025, from https://www.researchgate.net/figure/Evaluation-of-BET-surface-area-of-Vulcan-XC-72-carbon-Analysis-parameters_tbl2_280545959
Meeting, P. E. (n.d.). M2FCT: Million Mile Fuel Cell Truck Consortium. https://www.hydrogen.energy.gov/docs/hydrogenprogramlibraries/pdfs/review23/fc339_weber_2023_o-pdf.pdf
Ogungbemi, E., Wilberforce, T., Ijaodola, O., Thompson, J., & Olabi, A. G. (2021). Selection of proton exchange membrane fuel cell for transportation. International Journal of Hydrogen Energy, 46(59), 30625–30640. https://doi.org/10.1016/j.ijhydene.2020.06.147
Panalytical, M. (2019, July 19). Introduction to Dynamic Light Scattering Analysis. Youtube. https://www.youtube.com/watch?v=ET6S03GeMKE
Poojary, S., Islam, M. N., Shrivastava, U. N., Roberts, E. P. L., & Karan, K. (2020). Transport and electrochemical interface properties of ionomers in low-Pt loading catalyst layers: Effect of ionomer equivalent weight and relative humidity. Molecules (Basel, Switzerland), 25(15), 3387. https://doi.org/10.3390/molecules25153387
Share of greenhouse gas emissions in Canada 2023, by sector. (n.d.). Statista. Retrieved November 29, 2024, from https://www.statista.com/statistics/503526/greenhouse-gas-emissions-share-in-canada-by-economic-sector/
Suter, T. A. M., Smith, K., Hack, J., Rasha, L., Rana, Z., Angel, G. M. A., Shearing, P. R., Miller, T. S., & Brett, D. J. L. (2021). Engineering catalyst layers for next‐generation polymer electrolyte fuel cells: A review of design, materials, and methods. Advanced Energy Materials, 11(37), 2101025. https://doi.org/10.1002/aenm.202101025
The Paris Agreement. (n.d.). Retrieved October 14, 2024, from https://unfccc.int/process-and-meetings/the-paris-agreement
The Paris Agreement on Climate Change. (n.d.). https://www.nrdc.org/sites/default/files/paris-climate-agreement-IB.pdf
United Nations. (n.d.). Causes and Effects of Climate Change | United Nations. Retrieved October 14, 2024, from https://www.un.org/en/climatechange/science/causes-effects-climate-change
Us Epa, O. (2015). Sources of Greenhouse Gas Emissions. https://www.epa.gov/ghgemissions/sources-greenhouse-gas-emissions
Van Cleve, T., Khandavalli, S., Chowdhury, A., Medina, S., Pylypenko, S., Wang, M., More, K. L., Kariuki, N., Myers, D. J., Weber, A. Z., Mauger, S. A., Ulsh, M., & Neyerlin, K. C. (2019). Dictating Pt-based electrocatalyst performance in polymer electrolyte fuel cells, from formulation to application. ACS Applied Materials & Interfaces, 11(50), 46953–46964. https://doi.org/10.1021/acsami.9b17614
Xie, M., Chu, T., Wang, T., Wan, K., Yang, D., Li, B., Ming, P., & Zhang, C. (2021). Preparation, performance and challenges of catalyst layer for proton exchange membrane fuel cell. Membranes, 11(11), 879. https://doi.org/10.3390/membranes11110879
Zhao, J., Liu, H., & Li, X. (2023). Structure, property, and performance of catalyst layers in proton exchange membrane fuel cells. Electrochemical Energy Reviews, 6(1), 13. https://doi.org/10.1007/s41918-022-00175-1
Acknowledgement
Thank you to Dr. Kunal Karan and Vahid Mazinani from the Department of Chemical and Petroleum Engineering at the Schulich School of Engineering, University of Calgary.
Thank you to Dr. Garcia from Webber Academy for their guidance and support throughout this project.