What are the stability and infectivity levels of T4 bacteriophages in various environments varying in temperature and pH?
Grade 9
Presentation
Hypothesis
Testing the stability of T4 bacteriophages in multiple environments with varying temperature and pH levels
Experiment 1 Hypothesis: Testing the stability of phages in different temperatures
If we expose T4 bacteriophages to infect bacteria (E. Coli) at various temperatures (20℃, 30℃, 37℃, 50℃, 60℃, and 70℃), then the number of plaques (lysis zones) that will appear after exposure will be higher between the temperatures 30℃-37℃ (relatively closer to body temperature) because the T4 phage target E. Coli naturally thrives at these temperatures, so the optimal temperature of the T4 phage would match that of the E. Coli target and will promote phage lysis to the bacteria. According to two papers on testing the stability of phages in varying temperatures (see citations for more), the optimal temperatures that phages thrived in were between 20℃-50℃, and the average culturing/phage preparation temperatures for the experiments were between 37℃-40℃. In another paper, it was tested and then concluded that the optimal temperature for E. Coli bacterial growth was at 37℃, matching the rest of our information.
Experiment 2 Hypothesis: Testing the stability of phages in different pH levels
If we expose T4 bacteriophages to infect bacteria (E. Coli) at various pH levels (4, 5, 6, 7, 8, 9, 10), then the number of plaques (lysis zones) that will appear after exposure will be higher between the pH levels 6-7.4 because E. Coli bacteria thrives in the human body (around pH level 7.4) and in the urinary tract (around pH 6), so the optimal pH level of the T4 phage would match that of the E. Coli target, which will promote phage lysis to the bacteria. According to multiple papers (see citations for more), the average pH level for T4 phage stability is 6-7.4, matching the rest of our information and supporting our hypothesis.
For the second run of the experiment, we are still going to have the same hypotheses.
Research
What are Bacteriophages?
Bacteriophages, also known as phages, are viruses that only infect a single bacterial species or specific strains within a species. They are composed of a "head" with a nucleic acid genome in a capsid protein shell. For our experiment our goal was to test how effective phages are under different pH and temperature conditions.
Phages are classified by their structure and replication cycle and taxonomy. There are three different types of ways that phages asexually reproduce:
Lytic Cycle (Virulent Phages): Phages that infect a host cell to hijack the host's machinery, to propagate. The host cell then is lysed (broken open), releasing new phages. Clear plaques will show up when lytic cycle phages are cultured on bacterial lawns, because the infected bacteria are destroyed.

Lysogenic Cycle (Temperate Phages): When phages inject their genome, this is called prosphage. Prophage will either be dormants as a circular episome that replicates circular dna independently or be integrated into the bacterial chromosome, in this case the host's dna will be inherited by all of the daughter cells (8 -10). to conditions like stress, the prophage might switch to the lytic cycle,which would start phage replication killing the host cell. Lysogenic phages like Lambda phage usually form turbid plaques (cloudy areas) because they do not kill their host cells immediately.

Chronic Infection Cycle (Filamentous Phages): Phages that continuously replicate without causing host lysis. The host cell produces new phage particles that are secreted, but the host cell remains intact. Filamentous phages, such as M13 phage replicate by secreting virions, instead of killing the host phage particles are excreted through the cell membrane. This makes them hard to differentiate at times from lysogenic phages but their replication does not have a dormant prophage stage. ,
Another characteristic phages are classified based is their morphology, this would include traits like shape, tail type, and size.
Non - tailed phages: Just as the name suggests these phages do not have tails. The three known examples of these types of phages are filamentous phages (e.g., M13),pleomorphic phages (e.g., phi6), and polyhedralThese phages usually have an elongated or variable shape and typically have simpler mechanisms for attaching to and infecting host cells.
Tailed Phages (Caudovirales Order): Have a tail to control the injection of phage genomes into their host. There are 3 subclasses to this type of phage:
Podophages: Have short tails (e.g., T7 and P22). They inject DNA by attaching the tail fibers to the surface of the host, then administering their genome.
Myophages: This is the category that T4 phages fall into, these phages have a contractile tail, which allows them to inject its genome by contracting the tail sheath.
Siphophages: Have long flexible tails that help to attach themselves to bacterial cells, these phages like Lambda can not contract their tails like myophages.
Why we chose T4 Phages

T4 phages are one of the most commonly researched phages for phage therapy. Their head-tail structure and lytic cycle usage makes them perfect candidates for phage therapy usage, making them a great choice for us to run stability tests on as it has more real-world applicability.
What is Phage Therapy?
Phage therapy utilizes phages and their natural infection cycle to target and kill bacteria. Since bacteria have developed resistance to antibiotics at varying levels, some even at full immunity, phage therapy poses as a final solution to combat antibiotic resistance, named the antibiotic resistance crisis.
Only lytic phages are used in phages therapy, as phage production in the bacteria causes disruptions in its metabolism, eventually killing the bacteria. They do this by encoding Holins, endolysins, and spanins to break the cell wall and cell membrane.
Phages can target specific bacteria depending on the species of phage and are like laser-guided missiles, meaning they will only attack their target bacteria, making it somewhat guaranteed that they won't mess with the body mechanics if administered to the body.
Different Applications, Advantages, and Obstacles in Implementing Phage Therapy
Various applications of phage therapy include
- Medical fields
- Veterinary medicine
- Agriculture
- Gene editing
A lot of the research of phage therapy applications has been tied to the medical fields. Currently, there has been a development of the antibiotic resistance crisis, a problem that has occurred due to the overuse of antibiotics, causing bacteria to develop various levels of antibiotic resistance. Various bacterial strains have become superbugs, meaning they have been identified by WHO as bacterial strains that have complete immunity to all antibiotics, making them lethal. Phage therapy is considered to be the final solution that needs to be developed in order to combat antibiotic resistance in bacteria.
As research has been done mainly in the medical fields, there has been more development of research for phage therapy in those other fields listed above. Some of the other specific medical applications of phage therapy, besides combating antibiotic resistance, include
- Using it as a treatment option for bacterial infection developing antibiotic resistance
- Drug/genetic material delivery carriers to specific target regions (not limited to just bacterial infections; gene editing RBPs in phages may make this possible) for more precise/personalized medicine
- Using phages as tools to identify/diagnose different target issues, to confirm presence for less medical errors
- Curing cancer/in cancer research
There are many advantages to exploring and developing phage therapy, which make it a unique treatment that, if obstacles in its implementation can be combated, can be a very successful treatment.

Phages are very specific as to what they can infect. For example, one phage may only be able to infect an E. coli bacterial strain, while another phage may only be able to infect a staphylococcus bacterial strain. Because phages are so specific as to what they can infect, it makes it much easier to guarantee that they won’t mess with other body systems or cause multiple side effects. It was actually reported in some of the earlier tests that patients experienced around little to no side effects with the use of phage therapy because of how precise and selective they are.
Phages are living organisms that depend on infecting bacteria in order to continue to thrive and reproduce. That means, as bacteria continue to develop and evolve to protect themselves against phages, phages will also continue to evolve to overcome the obstacles for infection that bacteria may create through the generations. The key difference between phages and antibiotics is that phages can continue to evolve to keep up with bacteria, while antibiotics are only as good as we can make them, inevitably to a point where bacteria will become stronger and immune, like the problem we are currently facing.
Phages are easily customizable for different purposes like I mentioned above, like drug delivery, modification of phage target, and much more. They are easy to be implemented into personalized therapy, which is the more advanced healthcare experts are researching and looking to implement more and more.
There are a few obstacles that need to be overcome in order for phage therapy to be FDA-approved.
Phages are very specific as to what they can infect, which was mentioned to be an advantage. But, this characteristic also causes an obstacle. If we are to become partially or fully dependent on phage therapy, we need to make sure we can get access to various species of phages and create a phage library that holds phages that can infect multiple different types of bacteria. Or, we would need to develop technology like gene editing to modify the RBPs of phages so we can control what kind of bacteria the phage targets when we need it to.
Phages are living organisms that thrive best in specific environmental conditions. In order for phage therapy to be FDA-approved, we need to ensure that phages can successfully infect bacteria in various environmental conditions ranging in temperatures and pH (mainly pH if specifically for human applications). We also need to make sure that the phages can be long-lasting until use and can survive in various storage conditions that will range in both temperature and pH; that way, they won’t expire quickly, wasting both time and resources to create more of these treatments until use.
Another obstacle in phage therapy implementation is consistency. We need to make sure that the phages will be consistently safe to administer to the body through the process of more large-scale testing/clinical trials. We also need to ensure that phages will have about the same success rate in killing bacteria every time they are deployed. In order to become partially or fully dependent on phage therapy in the future, we need to be sure that they can consistently work.
An obstacle in phage therapy implementation is its interaction with the immune system. One of the concerns is that phages, once administered to the body, will be mistaken by the immune system as a threat. While this hasn’t always happened, we need to find ways to mask the phages or trick the immune system into not interacting with the phages as they are looking for the bacterial target.
One last obstacle is the biofilms that some bacteria have as a sticky protective layer. The biofilm can prevent the phage from being able to bind and access the bacteria to infect it, and there has been research on gene editing phages to overcome this obstacle as well.
Current Optimal Environments for Phages to Thrive
Phages are somewhat able to thrive in various environmental conditions. They have enough adaptability to survive in different temperatures and pH levels, but we still need to determine how well they will be able to perform in targeting and infecting bacteria in those changes in conditions.
As for pH levels, research has shown that phages thrive at pH levels 5-7, with significant biological activity between those ranges (Cong, 2024). The pHs tested in this study were 3, 5, 7, 9, 11, and 13, to be able to test an acceptable range of acidity and basic. At the most basic side tested, pH 13, there was significant decline in phage titer. At the most acidic tested, pH 3, there were generally no phage plaques detected.
For temperature resistance, the phages thrived the best between temperatures 20℃ - 50℃ (Cong, 2024). There is significant titer reduction at 60℃ and generally complete titer loss at 70℃ (Kering, 2020). Between 37℃ - 40℃ are optimal temperatures for growing and culturing phages, especially before use. 4℃ is a good temperature for storing the phages for longer periods of time until use. In these two studies, the temperatures 50℃ - 70℃ were tested. In the study by Cong in 2024, the additional temperatures 20℃, 30℃, and 40℃ were tested. In the study by Kering in 2020, it was shown that exposing the phages to temperature treatment triggered adaptive evolution and made the mutant phages more resistant to the varying temperatures.
Importance of Identifying Phage Stability to Improve Phage Therapy
One of the current obstacles in phage therapy already identified is stability of phages both in different environments when being administered and when being stored for long periods of time until use. Phages need to be stored, able to be transported, and effective as a treatment in various environmental conditions in order to be reliable and eligible to be FDA-approved. Being able to identify the current stability advantages and pain points for phages helps us identify
- Current optimal environments we know phages thrive at
- Pain points in phage stability that need to be improved upon for FDA approval and easier implementation
- Specific environmental factors that need to be taken into consideration to improve stability for when modifying the phages (either through evolution or gene editing)
This will allow us to further our research and target our resources in tackling the most prominent challenges.
Variables
Experiment 1: Testing the stability of phages in different temperatures
Manipulated Variable(s):
- The temperature that the phages will be treated with
Responding Variable(s):
- The amount of plaques (lysis zones) that will appear after the phages have been subjected to the varying temperature
- The phage titer (phage concentration) of the phages after it was exposed to the varying temperature
Controlled Variable(s):
| Controlled Variable: | Why is it necessary to control the variable? | How it will be controlled: |
| pH level | So the only variable that influences the results is the temperature. That way, the pH won't affect the results. | We are using standard LB broth across all conditions. |
| Phage dilution factor | If the phage dilution factors varied, then the calculated phage titers produced would not accurately represent the most suitable phage temperatures. | We aren't modifying the phage dilution of the solution throughout the experiment. We are also using a consistent volume of phage stock across all tested conditions. |
| Bacterial dilution factor | If the bacterial concentrations varied (one had more than another), then that could skew the results, as there is the possibility that a bacterial stock with more concentration could promote higher levels of growth, making the population tested unbalanced. |
We will be using a spectrophotometer to test and ensure that the bacterial dilution factor remains the same for every condition tested. |
| Volume of the phage stock used | Having more phages infecting the bacterial stock in one of the conditions could put it at an advantage compared to another condition tested where the phage stock is lower, which could skew the results. | We will be using standardized micropipettes when measuring out the volume of phage stock used in the experiment to ensure consistency throughout all conditions being tested. |
| Volume of the bacterial stock used | The volume of bacterial stock used affects the amount of organisms the phages need to infect. If the populations of the bacteria vary, then one set of phage stock would have to apply extra effort to infect all the bacteria. | We will use standardized micropipettes throughout the measuring of the bacterial stock to ensure consistency in volume amounts throughout all tested conditions. |
| The time that the phage/bacterial solution will be exposed to the temperatures |
If the phage/bacterial solution is exposed to a specific temperature for longer, then there is a higher chance of either a higher plaque concentration or bacterial/phage demise. |
We will be using a timer to make sure that the phage/bacterial solution is exposed to the desired temperature. This will ensure consistency across all conditions tested. |
Experiment 2: Testing the stability of phages in different pH levels
Manipulated Variable(s):
- The pH level that the phage/bacterial solution will be exposed to during testing
Responding Variable(s:)
- The amount of plaques (lysis zones) that will appear after the phages have been subjected to the varying pH level
- The phage titer (phage concentration) of the phages after it was exposed to the varying pH level
Controlled Variable(s):
| Controlled Variable: | Why is it necessary to control the variable? | How it will be controlled: |
| Temperature | The temperature needs to be standard throughout all tested conditions so that the only variable influencing the results is the pH level of the environment. | We will be using an incubator to ensure that the temperatures are maintained at the proper level (37℃). |
| Phage dilution factor | If the phage dilution factors varied, then the calculated phage titers produced would not accurately represent the most suitable phage temperatures. | We aren't modifying the phage dilution of the solution throughout the experiment. We are also using a consistent volume of phage stock across all tested conditions. |
| Bacterial dilution factor | If the bacterial concentrations varied (one had more than another), then that could skew the results, as there is the possibility that a bacterial stock with more concentration could promote higher levels of growth, making the population tested unbalanced. |
We will be using a spectrophotometer to test and ensure that the bacterial dilution factor remains the same for every condition tested. |
| Volume of the phage stock used | Having more phages infecting the bacterial stock in one of the conditions could put it at an advantage compared to another condition tested where the phage stock is lower, which could skew the results. | We will be using standardized micropipettes when measuring out the volume of phage stock used in the experiment to ensure consistency throughout all conditions being tested. |
| Volume of the bacterial stock used | The volume of bacterial stock used affects the amount of organisms the phages need to infect. If the populations of the bacteria vary, then one set of phage stock would have to apply extra effort to infect all the bacteria. | We will use standardized micropipettes throughout the measuring of the bacterial stock to ensure consistency in volume amounts throughout all tested conditions. |
| The time that the phage/bacterial solution will be exposed to the temperatures |
If the phage/bacterial solution is exposed to a specific temperature for longer, then there is a higher chance of either a higher plaque concentration or bacterial/phage demise. |
We will be using a timer to make sure that the phage/bacterial solution is exposed to the desired temperature. This will ensure consistency across all conditions tested. |
Procedure
1st Procedure for Testing Phage Effectiveness Under Different pH and Temperature Conditions (Organized with the help of AI)
Materials List
- LB broth (50 mL).
- Sterile inoculation loops.
- Sterile test tubes or flasks (39)
- Incubator
- Place to refrigerate the T4 phages until use
- Sterile saline solution or Phosphate-Buffered Saline (PBS) (50 mL).
- Micropipettes and sterile tips (10 µL, 100 µL, 1 mL, 10 mL tips).
- Sterile containers (13).
- Hydrochloric acid (HCl) solution (for changing pH).
- Sodium hydroxide (NaOH) solution (for changing pH).
- pH meter or pH indicator strips.
- Sterile water (500 mL).
- Sterile containers for buffer solutions (7).
- Nutrient agar plates (39).
- Soft agar (0.7% agar in LB broth) (130 mL).
- Sterile pipettes.
- Sterile spreaders.
- Personal protective equipment (gloves, lab coats, safety goggles).
- Waste disposal containers.
- Markers and labels for labelling tubes and plates.
- Timer or clock.
- Spectrophotometer.
- Cuvettes for spectrophotometer use.
Day 1: Preparation
Prepare E. coli Culture
Purpose: Grow E. coli bacteria in a liquid medium to use in the experiment.
Materials:
- E. coli agar plate.
- LB broth (∼40 mL).
- Sterile inoculation loops.
- Sterile test tubes or flasks.
- Incubator set to 28°C.
Steps:
- Use a sterile inoculation loop to pick a single colony from the E. coli agar plate.
- Transfer the colony into a sterile test tube containing 5 mL of LB broth.
- Gently swirl the tube to mix and suspend the bacteria in the broth.
- Repeat steps 1-3 for each experiment, preparing 3 separate test tubes of E. coli culture (one for each triplicate).
- Incubate the tubes at 28°C for 4 days to allow the bacteria to grow.
Prepare pH Buffer Solutions
Purpose: Prepare buffer solutions for the different pH conditions to test phage activity.
Materials:
- Hydrochloric acid (HCl) solution.
- Sodium hydroxide (NaOH) solution.
- pH meter or pH indicator strips.
- Sterile water.
- Sterile containers for buffer solutions.
Steps:
- Prepare sterile water or PBS in separate containers.
- Adjust the pH of each solution to the desired levels (pH 5, 6, 7, 8, 9) by adding small amounts of HCl to lower the pH or NaOH to raise it.
- Use a pH meter or pH strips to measure and confirm the pH of each solution.
- Prepare 3 separate buffer solutions for each pH level (one for each triplicate).
- Label 3 sterile test tubes for each pH condition (e.g., pH 5, pH 7, pH 9).
- Store the solutions at room temperature.
Day 2: Testing
Dilute E. coli Culture to OD600 = 0.08 - 0.12
Purpose: Standardize the bacterial concentration to ensure consistent testing.
Materials:
- Spectrophotometer.
- Cuvettes.
- Micropipettes and sterile tips.
- LB broth (∼10 mL).
Steps:
- Turn on the spectrophotometer and set it to 600 nm wavelength.
- Blank the spectrophotometer using a cuvette filled with sterile LB broth.
- Measure the OD600 of the E. coli suspension.
- If the OD600 is higher than 0.12, follow these steps to dilute it:
- Take 1 mL of the overnight E. coli culture and transfer it to a sterile test tube.
- Add 9 mL of fresh sterile LB broth to the tube.
- Mix gently by swirling or pipetting.
- Re-measure the OD600 to confirm it is close to 0.1. Adjust with more LB broth if needed.
- If the OD600 is lower than 0.08, follow these steps to increase it:
- Grow in incubator at 37℃ for 30-60 mins
- 6. Repeat steps for each of the 3 separate bacterial cultures prepared on Day 1.
Prepare Buffer Solutions for pH Testing
Purpose: Create stable environments with specific pH levels to test phage activity.
Materials:
- The pre-prepared buffer solutions (from Day 1).
- pH meter or pH indicator strips.
Steps:
- Retrieve the 3 pH-adjusted buffer solutions from Day 1 (each at different pH levels).
- Ensure that each solution is at the correct pH using a pH meter or pH strips.
pH Testing Setup
Purpose: Observe how different pH levels affect phage-bacteria interactions.
Materials:
- The prepared sterile test tubes.
- 1 mL of diluted E. coli culture for each setup.
- 1 mL of the corresponding pH-adjusted buffer solution for each setup.
- 100 µL of T4 phage stock solution for each setup.
- Sterile pipettes.
Steps:
- Add 1 mL of diluted E. coli culture to each tube (one for each triplicate).
- Add 1 mL of the corresponding pH-adjusted buffer solution to each tube (one for each triplicate).
- Add 100 µL of the T4 phage stock solution to each tube (dilution not required unless overcrowding occurs).
- Mix gently by pipetting up and down.
- Incubate the tubes at room temperature for 30 minutes.
- Repeat steps 1-6 for each pH condition, ensuring 3 separate sets for each (probably can do all at once since temperature doesn’t vary).
Temperature Testing Setup
Purpose: Determine how different temperatures affect phage effectiveness.
Materials:
- Sterile test tubes from each setup.
- 1 mL of diluted E. coli culture for each setup.
- 100 µL of T4 phage stock solution for each setup.
- Incubator set to the desired temperature (20°C, 37°C, or 60°C).
- Sterile pipettes.
Steps:
- Label 3 sterile test tubes for each temperature condition (e.g., 20°C, 37°C, 60°C).
- Add 1 mL of diluted E. coli culture to each tube (one for each triplicate).
- Add 100 µL of T4 phage stock solution to each tube (dilution not required unless overcrowding occurs).
- Mix gently by pipetting up and down.
- Place the tubes in the incubator set to the designated temperatures for 30 minutes.
- Repeat steps 1-5 for each temperature condition, ensuring 3 separate sets for each.
Plate the Samples
Purpose: Count plaques to measure phage activity.
Materials:
- Nutrient agar plates (for each condition).
- Soft agar (0.7% agar in LB broth).
- Sterile pipettes.
- Sterile spreaders.
- Incubator set to 37°C.
Steps:
- Add 3 mL of molten soft agar (∼45°C) to each tube containing the phage-bacteria mixture (one for each triplicate).
- Mix gently and pour the mixture onto 3 pre-labeled nutrient agar plates (one for each triplicate).
- Tilt the plates to spread the overlay evenly.
- Let the plates solidify at room temperature for 10 minutes.
- Incubate the plates at 37°C overnight.
Day 3: Data Collection
Count Plaques
Purpose: Measure phage effectiveness by counting lysis zones.
Materials:
- The plated nutrient agar plates.
- Pen to mark plaque locations.
Steps:
- Examine each plate for plaques (clear zones where phages lysed bacteria).
- Count plaques on plates with 30-300 plaques for accuracy.
- Record the plaque counts for each condition and for all 3 triplicates.
Calculate Phage Titer
Purpose: Quantify the concentration of phages in the stock solution or test samples.
Materials:
- The plated nutrient agar plates.
- Calculator for data analysis.
Steps:
- Count the number of plaques on a plate.
- Multiply the plaque count by the dilution factor used for that plate.
- Divide by the volume of the phage-bacteria mixture plated (in mL) to calculate the titer in PFU/mL.
Final Notes
• Aseptic Techniques: Always maintain sterility to avoid contamination.
• Consistency: Use the same volumes, timings, and procedures for all tests.
• Safety: Handle all materials, especially HCl and NaOH, with proper safety equipment (e.g., gloves, goggles).
2nd Procedure for Testing Phage Effectiveness Under Different pH and Temperature Conditions (developed with the help of James La)
Day 1 - Overnight culture of E. coli
Date: March 17-18, 2025
Objective
- Grow an overnight culture of E. coli
- Three were overnights were grown although only two is required for the experiment
Methods
Overnight culture of E. coli
- Add 5 mL of LB broth in a test tube.
- Inoculate a single colony of E. coli into the test tube using an inoculation loop.
- Incubate E. coli culture overnight (~18-22 hrs, no more than 24 hours) at 37°C with shaking (250 rpm).
Notes
- Three overnight cultures of E. coli were prepared and placed in the incubator at 37°C with 250 rpm at 3:57 PM (March 17, 2025)
- Overnight cultures were removed from the incubator at 1:10 PM (March 18, 2025)
- Overnight #1 — 0.154 OD600
- Overnight #2 — 0.284 OD600
- Overnight #3 — 0.156 OD600
- Overnight cultures were removed from the incubator at 1:10 PM (March 18, 2025)
Day 2 - Infection and Propagation of T4 Bacteriophage
Date: March 18, 2025
Objective
- Infect an overnight culture of E. coli with T4 bacteriophage for amplification
Methods
Bacteriophage Infection and Propagation (Amplification)
- Infect 5 mL of the overnight culture with 100 µL of T4 bacteriophage stock solution
- Incubate phage-infected E. coli culture at 37°C and 250 rpm (shaking) for 3-4 hours (bacterial culture should become clear).
- Centrifuge the phage-infected E. coli culture at 10,000 x g for 10 minutes.
- Collect the lysate/supernatant (solution above the bacterial pellet).
- Filter the lysate/supernatant through a 0.22 µm filter using a syringe.
- Store filtered lysate/supernatant at 4°C.
Notes
- E. coli was infected with T4 bacteriophage and placed in the incubator at 1:21 PM (March 18, 2025)
Day 3 - Plaque Forming Assay of T4 Bacteriophage against E. coli
Date: March 19-20, 2025
Objective
- Perform plaque forming assay with T4 bacteriophage against E. coli
- Determine PFU/mL of phage lysate
Methods
Plaque Forming Assay
- Melt LB soft agar and keep heated at 65°C
- In a separate Eppendorf tube, prepare 100 µL of a bacterial inoculum adjusted to 0.1 OD600 with LB broth.
- Transfer 50 L of 0.1 OD600 the E. coli suspension into 5 mL of Molten Soft Agar.
- Add 100 µL of T4 lysate
- Pour onto hard agar plate and swirl
- Wait until soft agar has solidified
- Parafilm plates and incubate for 18-24 hours at 37°C
Determining PFU/mL
- Count plaques on plates and calculate the PFU/mL (formula below):
PFU/mL = # of plaque counts dilution factorvolume of inoculum
- # of plaque counts = number of plaques (clear zones) on plates
- Dilution factor = factor by which phage was diluted before plating
- Volume of inoculum = volume of phage plates in mL
Day 4 - pH and Temperature Stability of T4 Bacteriophage
Date: March 19-20, 2025
Objective
- Subject T4 bacteriophage to various pH and temperature conditions
- Determine PFU/mL of phage lysate
Methods
Preparing pH-treated T4 Phage
- In a separate eppendorf, adjust phage stock to ~107 PFU/mL.
- In three separate eppendorf tubes, aliquot 100 µL of T4 phage solution into each eppendorf
- Add 100 µL of pH-adjusted buffer solution to respective eppendorf tubes
- Incubate at 37°C for 60 minutes
- Perform again for each pH treatment (pH untreated (LB broth), 3, 7, and 11) and for temperature (room temperature, 4°C, 37°C, 60°C)
- Temperature
- 4°C — Fridge
- 20°C — Room temperature (or incubator)
- 37°C — Incubator
- 60°C — Heat block or Hot water bath
- Temperature
Plaque Forming Assay
- Prepare 100 µL of E. coli at 0.1 OD600 from overnight culture
- Pipette 50 µL of this bacterial liquid culture into 5 mL of molten soft agar
- Add 100 µL of pH-treated T4 phage lysate
- Pour onto hard agar plate and swirl
- Wait until soft agar has solidified
- Parafilm plates and incubate for 18-24 hours at 37°C
Determining PFU/mL
- See Day 3 for steps.
Observations
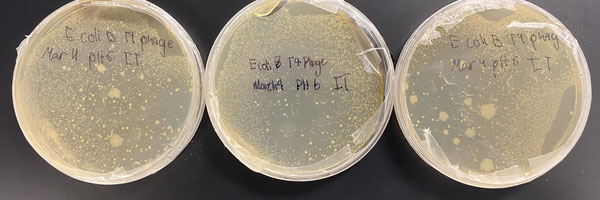
Procedure 1: Temperature Tests
|
Temperature |
Triplicate |
Image |
Observation |
|
20℃ |
#1 |
|
Not the results we are looking for. Bacteria come up in the yellow spots, noted as colonies. Not showing results of phage, although there was present infection. There are a few prominent bacterial colonies. |
|
20℃ |
#2 |
|
Smaller scatter of bacterial colonies. Still no plaques being identified. |
|
20℃ |
#3 |
|
Largest of the 20℃ triplicate of bacterial colonies. The plaques did not show up on this petri dish, not showing the infection areas. |
|
37℃ |
#1 |
|
Fair bacterial colony activity, around the same amount as in 20℃. Can guess that phages had better infection rates here. |
|
37℃ |
#2 |
|
More bacterial colonies here. Not showing phage plaque formation. |
|
37℃ |
#3 |
|
Scatter of bacterial colonies, still no plaque formation. |
|
60℃ |
#1 |
|
Very little, one or two bacterial colonies at sixty. Probably no phage or bacterial action at this temperature. |
|
60℃ |
#2 |
|
No bacterial colonies or plaques. |
|
60℃ |
#3 |
|
Moisture build-up. One or two bacterial colonies, no phage activity is detected. |


Procedure 1: pH Tests
|
pH |
Triplicate |
Image |
Observation |
|
5 |
#1 |
|
Similar to temperature tests, there are no signs of phage plaques, but there are bacterial colonies. There are quite a few in this petri dish. |
|
5 |
#2 |
|
Scatter of bacterial colonies, no phage plaques. Agar is broken up. |
|
5 |
#3 |
|
Agar is broken a little. Scatter of bacterial colonies, no phage plaques. |
|
6 |
#1 |
|
Cannot identify phage activity, fair amount of bacterial colonies. |
|
6 |
#2 |
|
Scatter of bacterial colonies, no plaques. |
|
6 |
#3 |
|
Larger bacterial colonies, no phage plaques. |
|
7 |
#1 |
|
Larger amount of bacterial colonies as well as fairly scattered, no plaques for phage activity. |
|
7 |
#2 |
|
Scatter of bacterial colonies, no phage plaques. |
|
7 |
#3 |
|
Scatter of bacterial colonies with a couple large colonies, no plaques. |
|
8 |
#1 |
|
Scatter of bacterial colonies, no plaques. |
|
8 |
#2 |
|
Scatter of bacterial colonies, no plaques for phage activity. |
|
8 |
#3 |
|
Larger amounts of bacterial colonies, no plaques. |
|
9 |
#1 |
|
Scatter of bacterial colonies, rather minimal. No plaques for phages. |
|
9 |
#2 |
|
Minimal scatter of small bacterial colonies, no phage plaques. |
|
9 |
#3 |
|
Agar somewhat broken, didn't settle correctly. No phage plaques. Scattered bacterial colonies. |


Procedure 2: Temperature Tests
|
Temperature |
Triplicate |
Photo |
Notes |
|
60℃ |
1 |
|
Number of plaques: 2 Small plaques, inconsistency in plating |
|
60℃ |
2 |
|
Number of plaques: 2 Small plaques, large circles as air bubbles |
|
60℃ |
3 |
|
Number of plaques: 2 Small plaques, large circles as air bubbles |
|
37℃ |
1 |
|
Number of plaques: estimate 5000 based on previous plaques Small plaques with larger yield. Larger circles as air bubbles |
|
37℃ |
2 |
|
Number of plaques: estimate 5000 based on previous plaques Small plaques with large yield. Large circles as air bubbles |
|
37℃ |
3 |
|
Number of plaques: estimate 5000 based on previous plaques Small plaques with large yield |
|
4℃ |
1 |
|
Number of plaques: estimate 5000 based on previous plaques Small plaques with large yield, large circles as air bubbles |
|
4℃ |
2 |
|
Number of plaques: estimate 5000 based on previous plaques Small plaques with large yield |
|
4℃ |
3 |
|
Number of plaques: estimate 5000 based on previous plaques Small plaques with big yield, large circles as air bubbles |
|
Room Temperature |
1 |
|
Number of plaques: 716 Small plaques |
|
Room Temperature |
2 |
|
Number of plaques: 636 Small plaques, large circles as air bubbles |
|
Room Temperature |
3 |
|
Number of plaques: estimate of 2000 based on previous plaques Small plaques with big yield, large circles as air bubbles. Outlier in room temperature tests |


Procedure 2: pH Tests
|
pH |
Triplicate |
Photo |
Notes |
|
11 |
1 |
|
Number of plaques: 540 Small plaques, large circles are air bubbles |
|
11 |
2 |
|
Number of plaques: 224 Small plaques, large circles are air bubbles |
|
11 |
3 |
|
Number of plaques: 368 Small plaques, no air bubbles or inconsistencies in plate |
|
7 |
1 |
|
Number of plaques: 388 Small plaques, no air bubbles or inconsistencies in plate. More prominent compared to other 2 for pH 11 |
|
7 |
2 |
|
Number of plaques: 340 Small plaques, some large circles which are air bubbles |
|
7 |
3 |
|
Number of plaques: 816 Small plaques, large circles as air bubbles |
|
3 |
1 |
|
Number of plaques: 500 Small plaques, one large circle as air bubble, inconsistency in plating |
|
3 |
2 |
|
Number of plaques: 396 Small plaques, inconsistency in plating |
|
3 |
3 |
|
Number of plaques: 292 Small plaques, inconsistency in plating |
|
Control |
1 |
|
Number of plaques: 420 Small plaques, inconsistency in plating |
|
Control |
2 |
|
Number of plaques: 300 Small plaques, large circles as air bubbles |
|
Control |
3 |
|
Number of plaques: 208 Small plaques, large circles as air bubbles, inconsistency in plating |


Analysis
Procedure 1
After conducting our experiments and looking at the petri dishes, we couldn’t see any plaques. Plaques are where the phages have performed lysis on the bacteria. We were going to count out the number of plaques we saw on the petri dish, then use those numbers to calculate the rate of infection and the overall phage effectiveness infecting bacteria in various conditions.
All we could observe on the petri dishes were bacterial colonies, which shows that there was growth of culture. We weren’t able to observe any phage activity in the form of plaques. In our experiment, we mixed the phages and bacteria together and exposed them to the specific environmental condition for 30 minutes to allow the phage to attempt to infect the bacteria. Then, we would plate the phage/bacterial mixture and be able to view the results. Our thought process behind this was to simulate the phage finding a bacteria in the specific environment and then having to infect it.
After finishing our experiment, we found that this part of our procedure was flawed. What we learned was that we should have taken the phages and exposed them to the specific environmental condition separate from the bacteria because this experiment is focusing on phage efficacy, not bacteria efficacy. Then, after exposing that phage to the condition for the desired duration, 30 minutes for our experiment, we would then add it to the bacteria straight on a petri dish. The bacteria would be cultured separately as we had already done, but then we would plate the bacteria to form a bacterial lawn on the petri dish. Then, we would take our treated phages and streak it over that lawn with an inoculation loop. Then, we would incubate and allow the treated phages to infect and see how well they could infect after being treated with a specific condition.
The flaw is that we wouldn’t be able to see the results of the phages infecting the bacteria in the procedure that we used. But there was still infection and activity of the phages, which wasn’t the issue.
What we can take from this is to see the growth of the bacteria after being exposed to the varying environments. Also, since there was around equal concentration of bacteria, we can see from the varying colonies that were produced either
- Where phages were more/less active
- Where the conditions were more/less optimal for growth
- Where bacteria were able to survive the phages
It is hard to determine which result is which, so we can’t make any definite conclusions from our experiment.
Procedure 2
After this second trial run of our experiment, we were able to gather the data we were looking for. Plaques were visible after incubation of the plates. When we did this trial, we had exposed the phages to the specific test condition separately, without bacteria present as well. Then, after the phages were exposed to the condition, we mixed them with the bacteria and plated them on Petri dishes to see the results of their exposure.
For the temperature tests, we found that 4℃ and 37℃ were the most optimal temperatures for phage infection success because they were the temperatures that yielded the most plaques. We found that the plaques had well exceeded an amount that could be counted with accuracy, so we estimated around 5000 plaques for those plates based on the previous plates we had counted and the number of plaques they had yielded.
We found that at room temperature there was an outlier that yielded an estimated 2000 plaques, compared to the other two trials at room temperature where there weren't many plaques, which was interesting to see. We had also expected to see more growth at room temperature compared to at 4℃ because 4℃ slows down bacteria and phages to keep them stored for longer periods, but we weren't sure about how effective they could be at infecting at that condition.
In this graph, temperature 60℃ is not visible because of the low titer, but there were still minimal plaque yields.
|
10^5 PFU/mL (before and after StDev) |
|
|
6.76 |
0.57 |
|
50 |
0 |
|
50 |
0 |
|
0.02 |
0 |

For pH testing, we found that pH 3 was the most optimal for phage growth, but it wasn't that big of an optimal pH compared to the other ones tested. pH levels 7 and 11 were also fairly optimal, but they had an inconsistency of high plaque numbers. In those pH levels, there were both high and low plaque yields within the three trials. We were expecting that pH 7 would be the most optimal, so it was interesting to see pH level 3 as the most optimal from our experiment.
|
10^5 PFU/mL (before and after StDev) |
|
|
3.09 |
1.06 |
|
3.96 |
1.04 |
|
3.64 |
0.39 |
|
3.77 |
1.58 |

Conclusion
Procedure 1
Because our experiment had a flaw in showcasing our results, we cannot come to any definite conclusion about our hypotheses. We can confirm that there was bacterial growth, and we can infer that there must have been phage lysis, even though it couldn’t have been reflected in plaques on the petri dishes due to the procedure flaw. The bacterial colonies that were shown in the petri dishes could show us the relative optimal/non-optimal conditions for phages to thrive and eliminate bacteria based on the number of colonies. But, we can’t be for sure what each number of colonies on the petri dishes represent. For example, if nothing appeared on a petri dish, it could either be because everything perished, meaning the condition wasn’t optimal, or that the phages performed lysis on all the bacteria, meaning the condition was still optimal. But we wouldn’t be able to tell without those plaques being shown. Our next step is to return to the lab to repeat our experiment and adjust our procedure so that we can gather data and find conclusions to our hypotheses.
Procedure 2
After conducting our tests, we found that temperatures 4℃ and 37℃ and pH 3 were most optimal for phage infection. The temperature results partly match our hypothesis, stating that the range between 30℃ - 37℃ would be most optimal. We had stated in our hypothesis that the temperature ranges 20℃- 50℃ would also be fairly optimal, based on the information we found in the papers. But, at room temperature, the phages did not perform as successfully as they did in those other two temperatures. However, there was an outlier in the room temperature trial, which could possibly support our hypothesis and other research if the experiment for that trial was repeated. As for the pH, our hypothesis stated that the pH range from 6 - 7.4 would be most optimal, but after performing our experiments we found that pH 3 was best for phage infection. This does contradict what other research has found, so it would be best to re-perform the experiment to test the data again. Also, pH levels 7 and 11 still yielded good plaque amounts, but they were inconsistent, with both high and low values, while pH 3 was more consistent with higher values.
Application
Real-life applications for the project:
Currently, one of the biggest obstacles to implementing phage therapy in clinical applications is ensuring the stability and success of the phages depending on the environment in which it is stored/administered. Because of this, there has been a lack of progress in getting phage therapy FDA-approved for use. Being able to determine the current stability challenges/preferences for phages will help us identify
- The current optimal environments we know phages thrive at
- Through controlled experiments we can find out the most optimal storage conditions for phages.
- For example, some phages might remain stable at refrigeration temperatures (4°C) but degrade at room temperature (25°C) or higher (e.g., 40°C).
- Can be helpful for industries like pharmaceuticals, agriculture, and food preservation, where phage use could replace chemical antibiotics.
- The pain points in phage stability that need to be improved upon for FDA approval and easier implementation
- Why is FDA approval slow? A major reason is its inconsistent effectiveness due to environmental instability.
- The specific environmental factors that need to be taken into consideration to improve phage stability when modifying the phages (either through evolution or gene editing)
- If our research identifies that certain environmental factors (such as low pH or detergents) severely limit phage function, scientists can selectively breed or engineer phages with stronger protective proteins or resistance mechanisms.
- Example: A phage that is naturally sensitive to high temperatures might be modified to include heat-resistant proteins, allowing it to remain effective at body temperature (37°C) for therapeutic applications.


There has also been a rise in antibiotic resistance (AMR) that is developing in bacteria, making it difficult to combat the infections they cause with traditional treatments. Because of this, it is necessary to continue to research alternative treatments that can either work independently or alongside antibiotics. Phage therapy has proven to be successful when implemented. Being able to overcome the obstacles in its approval will be the key to saving the lives of millions of people.
Future application to the project:
We could extend our research by running the same tests on numerous species of phages/strains of bacteria. This would allow us to gather more extensive information that can be utilized further to gain better understanding of the common pain points in phage stability across the board.
We could continue our current research by combining the different environmental factors by measuring the phage titers after being subjected to a combination of pH levels and temperatures (for example creating an environment with a pH level of 6 and temperature of 40℃), that way it can reflect more real-life occurring scenarios.


Sources Of Error
Procedure 1
1. pH is not 100% accurate, but rather an estimate
2. Sizes of bacterial samples may not be uniform because two different sizes of inoculation loops were used in the growth process
3. Bacterial dilution is not all uniform because of the dilution range that is allowed: from 0.08 to 0.12
4. The agar applied to the plates was not a smooth surface, so there was some constraint in bacterial growth
5. The phages should have been treated separately and then applied to the bacteria afterwards, so results do not reflect what we were looking for
Procedure 2
1. pH is not 100% accurate, but rather an estimate
2. Phage dilution may not all be uniform, but rather based on an estimate
3. Minimal occurrences of inconsistent agar plating
4. Plaque counts may not be 100% accurate, but rather an estimate
Citations
References
Asmare, Z. (2024, August 13). Antimicrobial resistance profile of Pseudomonas aeruginosa clinical isolates from healthcare-associated infections in Ethiopia: A systematic review and meta-analysis. PMC. Retrieved March 6, 2025, from https://pmc.ncbi.nlm.nih.gov/articles/PMC11321567
CDC. (2019). Multidrug-Resistant Pseudomonas Aeruginosa [Infographic]. CDC. Retrieved March 6, 2025, from https://www.cdc.gov/antimicrobial-resistance/media/pdfs/pseudomonas-aeruginosa-508.pdf
Haenssgen, M. J. (2018, November 1). The Consequences of AMR Education and Awareness Raising: Outputs, Outcomes, and Behavioural Impacts of an Antibiotic-Related Educational Activity in Lao PDR. Antibiotics, 7(4), 95. https://doi.org/10.3390/antibiotics7040095
Keen, E. C. (2016, January 1). A century of phage research: Bacteriophages and the shaping of modern biology. A century of phage research: Bacteriophages and the shaping of modern biology. Retrieved March 6, 2025, from https://pmc.ncbi.nlm.nih.gov/articles/PMC4418462/
Mcvay, C. S. (2007, March 26). Phage Therapy of Pseudomonas aeruginosa Infection in a Mouse Burn Wound Model. PMC. Retrieved March 6, 2025, from https://pmc.ncbi.nlm.nih.gov/articles/PMC1891379
Shbaita, S. (2023, December 20). Antibiotic resistance profiles and associated factors of Pseudomonas Infections among patients admitted to large tertiary care hospital from a developing country. Antimicrobial Resistance & Infection Control, 12(149). https://aricjournal.biomedcentral.com/articles/10.1186/s13756-023-01355-4
Delbruck, M., & Luria, S. (2022, January 1). Growth and Maintenance of Escherichia coli Laboratory Strains. PMC. Retrieved March 6, 2025, from https://pmc.ncbi.nlm.nih.gov/articles/PMC8006063/
EPA. (2024, November 4). What is pH? | US EPA. Environmental Protection Agency. Retrieved March 6, 2025, from https://www.epa.gov/goldkingmine/what-ph
Hopkins, E. (2022). Physiology, Acid Base Balance. StatPearls Publishing. https://www.ncbi.nlm.nih.gov/books/NBK507807/#:~:text=In%20the%20absence%20of%20pathological,most%20important%20being%20blood%20oxygenation
Meyer, A. (2017, December 1). Stabilization of T4 bacteriophage at acidic and basic pH by adsorption on paper. Colloids and Surfaces B: Biointerfaces, 160, 169-176. https://doi.org/10.1016/j.colsurfb.2017.09.002
Chan, B. K. (2013). Phage cocktails and the future ofphage therapy. Review Future Microbiology, 8(6), 769-783. https//wwwtandfonlinecom/doi/epdf/102217/fmb1347?needAccess=true
Fister, S. (2016, July 27). Influence of Environmental Factors on Phage–Bacteria Interaction and on the Efficacy and Infectivity of Phage P100. Frontiers in Microbiology, 7. https://doi.org/10.3389/fmicb.2016.01152
García-Cruz, J. C. (2023, April 21). Myriad applications of bacteriophages beyond phage therapy. PMC. 10.7717/peerj.15272
Kasman, L. M. (2022). Bacteriophages. StatPearls Publishing. https://www.ncbi.nlm.nih.gov/books/NBK493185/
Laanto, E. (2020, May 29). Adapting a Phage to Combat Phage Resistance. Antibiotics, 9(6). https://doi.org/10.3390/antibiotics9060291
Sompolinsky, D. (1985, November 1). Encapsulation and capsular types in isolates of Staphylococcus aureus from different sources and relationship to phage types. Journal of Clinical Microbiology, 22(5). https://doi.org/10.1128/jcm.22.5.828-834.1985
Valencia-Toxqui, G. (2024, September 12). How to introduce a new bacteriophage on the block: a short guide to phage classification. American Society for Microbiology, 98(10). https://journals.asm.org/doi/pdf/10.1128/jvi.01821-23
Cong, X. (2024, November 16). Isolation, Characterization, and Genome Engineering of a Lytic Pseudomonas aeruginosa Phage. Microorganisms, 12(11). https://doi.org/10.3390/microorganisms12112346
Nobrega, F. L. (2016, December 15). Genetically manipulated phages with improved pH resistance for oral administration in veterinary medicine. Scientific Reports, 6. https://www.nature.com/articles/srep39235
Kering, K. K. (2020, April 9). Application of Adaptive Evolution to Improve the Stability of Bacteriophages during Storage. Viruses, 12(4). https://doi.org/10.3390/v12040423
Cox, D. (2022, August 15). Can phage therapy answer the booming antibiotic resistance problem? LABIOTECH. Retrieved March 11, 2025, from https://www.labiotech.eu/in-depth/phage-therapy-antibiotic-resistance/
Li, Y. (2020, October). Phage Therapy: Consider the Past, Embrace the Future [Graphic]. ResearchGate. Retrieved March 11, 2025, from https://www.researchgate.net/figure/The-main-strategies-for-phage-therapy-The-black-circle-indicates-that-a-variety-of_fig2_344962336
Osborne, S. (n.d.). Can Phage Therapy Replace Antibiotics in Growth Promotion? Global Food Safety Resource. Retrieved March 11, 2025, from https://globalfoodsafetyresource.com/can-phage-therapy-replace-antibiotics-in-growth-promotion/
Salvatori, E. (n.d.). Phage therapy: a “modern” approach against antibiotic resistance. vitares. Retrieved March 11, 2025, from https://www.vitares.org/en/magazine-en/143-phage-therapy-a-modern-approach-against-antibiotic-resistance
Pollenz, R. S. (2022, November 17). Bioinformatic characterization of endolysins and holin-like membrane proteins in the lysis cassette of phages that infect Gordonia rubripertincta. PLOS One. https://doi.org/10.1371/journal.pone.0276603
Acknowledgement
1) Jon Mee - Provided a lab as well as all the necessary equipment to run our experiments. Could not have done this project without his assistance.
2) Breanne Bali - Lab technician in the lab, helped us with equipment usage and provided us with all the materials and any other support we needed.
3) James La - Helped us on day 2 and 3 of the experiment directly with our procedure, as well as offered his time to re-perfrom the experiment and give us assistance on conducting the procedure/collecting data. Could not have done this project without his assistance.
4) Mount Royal University Laboratory - Lab location as well as where all the equipment for our experiments came from.
5) Anita Natale - Helped us with obtaining our bacteriophage/E. Coli culture for the experiment. Advised as well on how to maintain and care for the product until use.
6) AYVA - Where we purchased the bacteriophage/E. Coli culture set.
7) Google - Big source for our research and where we found our papers, articles, and other information to help us formulate the technical aspect of our experiment.
8) ChatGPT - We used ChatGPT to help us come up with our procedure for our project as well as format it for better clarity and understanding.