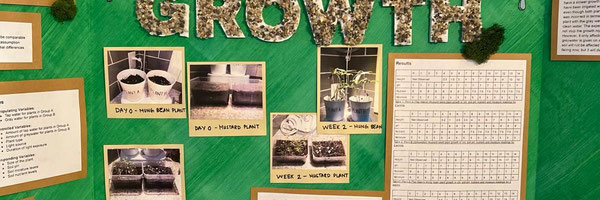
The effect of recycled greywater irrigation on plant growth
Muhammad Huzaifah Salman
Grade 6
Presentation
Hypothesis
If plants are irrigated with greywater, I predict that their growth will be comparable to plants irrigated with tap water. This expectation is based on the assumption that the soil, acting as a natural filtration system, will reduce potential differences in the growth rate between both plants.
Research
Introduction
Water is a scarce resource and the agricultural sectors consume more of the world’s accessible freshwater than any other industry (2). Water conservation has become a significant challenge for everyone globally. It has also become very important to find ways to conserve freshwater due to its shortage. One of the ways we can reduce pressure on municipal water supplies is to reuse greywater for irrigation around homes such as watering indoor plants, gardens, and small greenhouses.
What is Greywater?
Greywater is wastewater from sources like hand basins, washing machines, showers, and baths, kitchen areas and this water is of lower quality than drinking water (3). Greywater does not include waste from urinals and toilets; the main components of greywater are soaps and detergents. It’s said that greywater can be safely reused for the garden when it’s properly handled (3).
Purpose
The primary objective of this experiment is to investigate the impact of greywater reuse for irrigation on plant growth, soil pH, and nutrient contents in comparison with tap water. The study focuses on two distinct plant types, mustard plants and mung bean plants.
Objectives:
- Examine the rate of growth in mustard plants and mung bean plants when irrigated with greywater and tap water.
- Analyze changes in soil pH, soil nutrients, and moisture levels for each plant type.
- Determine whether there are similarities or differences in the growth rates, soil nutrients, and moisture levels between plants irrigated with greywater and tap water.
Variables
Manipulated variables:
- Tap water for plants in Group A
- Grey water for plants In Group B
Controlled variables:
- Amount of tap water for plants in group A
- Amount of grey water for plants in group B
- Plant type
- Light source
- Duration of light exposers
Responding variables:
- Size of the plant
- Soil pH
- Soil moisture levels
- Soil nutrient levels
Procedure
- Preparation of Pots:
- In 4 small plastic pots, add 247.5 grams of soil.
- Label two containers as "Plant A" and the other two as "Plant B."
- Seeding:
- On a weighing scale, place a tissue paper and weigh 2.0 grams of mustard seeds twice.
- In the first set of Plant A and Plant B pots, plant the weighed 2.0 grams of mustard seeds in each pot.
- In the second set of Plant A and Plant B, plant roughly 25 mung beans in each pot.
- Initial Watering:
- Give each pot containing the seeds and beans a few sprinkles of potable water.
- Light Exposure:
- Place all the pots under the lamp for at least 16-18 hours of light every day for two weeks.
- Regular Irrigation:
- Irrigate Plant A of mustard seeds and Plant A of mung beans with 25 mL of tap water every day for two weeks.
- Irrigate Plant B of mustard seeds and Plant B of mung beans with 25 mL of greywater collected from hand basins.
- Monitoring:
- Using a soil tester, record pH, soil moisture, and nutrient levels of each plant pot daily in the log book.
- Observations:
- Record observations in the log book for two weeks.
Observations
|
0 |
1 |
2 |
3 |
4 |
5 |
6 |
7 |
8 |
9 |
10 |
11 |
12 |
13 |
14 |
|
|
Height |
Not Observed |
0.5 |
1.5 |
3 |
4 |
5 |
7 |
8 |
9 |
9 |
10 |
10 |
|||
|
pH |
7 |
7 |
7 |
7 |
7 |
7 |
7 |
7 |
7 |
7 |
7 |
7 |
7 |
7 |
7 |
|
Nutrient |
8 |
8 |
8 |
8 |
8 |
8 |
8 |
7.5 |
7.5 |
7.5 |
7.5 |
7.5 |
7.5 |
7.5 |
7.5 |
|
Moisture |
5 |
5 |
5 |
5 |
5 |
5 |
5 |
5 |
5 |
5 |
5 |
5 |
5 |
5 |
5 |
Table 1: Plant A (Tap Water) Mustard seed plant growth in cm, soil pH, nutrient and moisture readings for 2 weeks.
|
0 |
1 |
2 |
3 |
4 |
5 |
6 |
7 |
8 |
9 |
10 |
11 |
12 |
13 |
14 |
|
|
Height |
Not Observed |
0.2 |
1 |
2.5 |
3.5 |
4 |
5 |
6 |
7 |
8 |
9 |
9.5 |
|||
|
pH |
7 |
7 |
7 |
7 |
7 |
8 |
8 |
8 |
8 |
8 |
8 |
8 |
8 |
8 |
8 |
|
Nutrient |
8 |
8 |
8 |
8 |
8 |
8 |
8 |
8 |
7.5 |
7.5 |
7.5 |
7.5 |
7.5 |
7.5 |
7.5 |
|
Moisture |
5 |
5 |
5 |
5 |
5 |
5 |
5 |
5 |
5 |
5 |
5 |
5 |
5 |
5 |
5 |
Table 2: Plant B (Greywater) Mustard seed plant growth in cm, soil pH, nutrient and moisture readings for 2 weeks.
|
0 |
1 |
2 |
3 |
4 |
5 |
6 |
7 |
8 |
9 |
10 |
11 |
12 |
13 |
14 |
|
|
Height |
Not Observed |
0.5 |
2 |
3 |
6 |
7 |
9 |
11 |
12 |
14 |
15 |
17 |
19 |
||
|
pH |
7 |
7 |
7 |
7 |
7 |
7 |
7 |
7 |
7 |
7 |
7 |
7 |
7 |
7 |
7 |
|
Nutrient |
8 |
8 |
8 |
8 |
8 |
8 |
8 |
7 |
7 |
7 |
7 |
7 |
7 |
7 |
7 |
|
Moisture |
6 |
6 |
6 |
6 |
6 |
6 |
6 |
6 |
6 |
6 |
6 |
6 |
6 |
6 |
6 |
Table3: Plant A (Tap Water) Mung bean plant growth in cm, soil pH, nutrient and moisture readings for 2 weeks.
|
0 |
1 |
2 |
3 |
4 |
5 |
6 |
7 |
8 |
9 |
10 |
11 |
12 |
13 |
14 |
|
|
Height |
Not Observed |
0.5 |
1 |
2.5 |
4 |
5 |
7 |
9 |
10 |
12 |
15 |
17 |
|||
|
pH |
7 |
7 |
7 |
7 |
7 |
7.5 |
7.5 |
7.5 |
8 |
8 |
8 |
8 |
8 |
8 |
8 |
|
Nutrient |
8 |
8 |
8 |
8 |
8 |
7.5 |
7.5 |
7.5 |
7.5 |
7 |
7 |
7 |
7 |
7 |
7 |
|
Moisture |
6 |
6 |
6 |
6 |
6 |
6 |
6 |
6 |
6 |
6 |
6 |
6 |
6 |
6 |
6 |
Table 4: Plant B (Greywater) Mung bean plant growth, soil pH, nutrient and moisture readings for 2 weeks.
Analysis
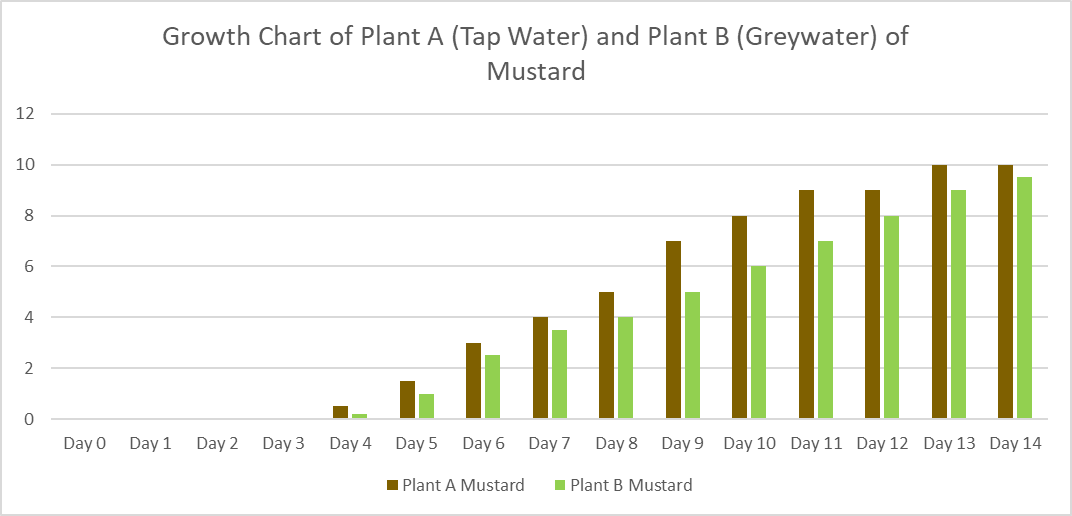
Figure 1: Growth chart of plant A and plant B of Mustard, height measured in cm over a period of 14 days.
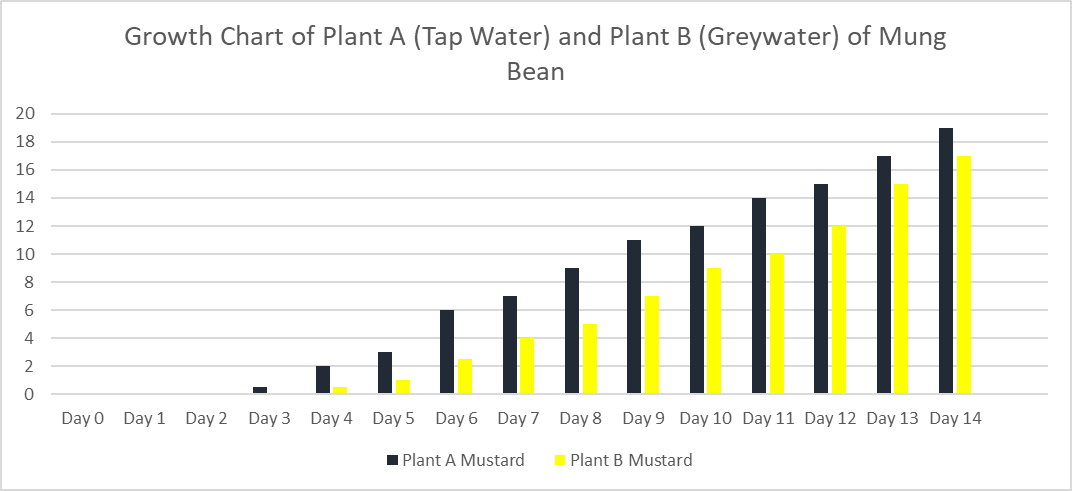
Figure 2: Growth chart of plant A and plant B of Mung bean, height measured in cm over a period of 14 days.
Conclusion
The experiment has shown that plants that are irrigated with 100% greywater have a slower growth and an increase in soil pH compared to the plants that have been irrigated with tap water. My hypothesis was partially correct because even though both plants grew due to the natural filtration system of the plants, I was incorrect in terms of the both plants having the same growth rate as the plant with the gray water grew at a slower rate compared to the plant with the clean water. The experiment has shown that using greywater for irrigation does not stop the growth nor changes the nutrient and moisture levels of the plant. However, it only affects the plant's rate of growth and the pH of the soil. If greywater is given on alternate days with tap water, it's safer and the pH of the soil will not be affected much. This will not resolve the water shortage issue we’re facing now, but it will definitely help in the long run.
Application
Water conservation has emerged as a pressing global concern, underscored by the scarcity of freshwater resources. This challenge is particularly pronounced in regions like Calgary, where delayed winters and early springs exacerbate the risk of potable water shortages due to reduced precipitation. The current situation in Alberta exemplifies this issue, with drought conditions prevailing across much of the province. The low snowpack in winter 2022/23, coupled with minimal precipitation in 2023, has led to water shortages and the declaration of agricultural disasters in numerous areas. While Alberta traditionally relies on melting snow and precipitation for its water supply, the reality of water scarcity is becoming increasingly evident, especially in southern Alberta. The repercussions of drought are far-reaching, encompassing degradation or loss of vegetation, fish, and wildlife, economic setbacks in agriculture and related industries, imposition of water restrictions, and heightened forest fire risk.
In 2010, the Government of Alberta introduced the "Agriculture Drought Risk Management Plan for Alberta," aimed at providing a framework for managing the impacts of drought on agricultural regions within the province. Subsequently, in 2016, following the 2015 drought, this plan was replaced by "Alberta’s Agriculture Drought and Excess Moisture Risk Management Plan.
According to John Pomeroy, the Canada Research Chair in Water Resources and Climate Change, eastern and southern Alberta are facing some of the most severe drought conditions on record, characterized by lower river flows compared to previous drought periods. Pomeroy states, “We've had lower river flows in '22-'23 than we did back in that drought. So hydrologically, the drought we're in now is worse than that”.
Sources Of Error
The sources of error:
1. The greywater is collected daily by washing hands in the hand basin, which makes the quality of the greywater inconsistent.
2. The tap water - the quality of the tap water is not checked daily before watering, there are chances that some days the minerals or fluoride levels are different.
3. Incorrect measurements of the plants - although the same scale was used to measure both plant A and plant B, there are possibilities that since it's measured every day it's not uniformly measured.
Citations
1 - World WildLife. Water Scarcity. Retrieved from https://www.worldwildlife.org/threats/water-scarcity
2- 2024 World Wildlife Fund WWF®. Water Scarcity Causes. Retrieved from https://www.worldwildlife.org/threats/water-scarcity#:~:text=Agriculture%20uses%2070%25%2of%20the,in%20which%20they%20are%20grown.
3 - Better Health Channel. Greywater - recycling water at home. Retrieved from
4- Drought 101 Retrieved from
https://www.alberta.ca/drought-101
5- Low snowpack, warm temperatures raise concern about continued Alberta drought Retrieved from https://calgary.ctvnews.ca/low-snowpack-warm-temperatures-raise-concern-about-continued-alberta-drought-1.6748903
Acknowledgement
This experiment and project presentation wouldn't be possible without the help of my parents, my homeroom teacher Ms Crookes, and my tutor Mr. Atique.