The significance of cerebrospinal fluid protein biomarkers in predicting cognitive decline in transient ischemic attack patients
Grade 11
Presentation
Problem
The prevalence of neuropathologies that result in irreparable brain damage is increasing at an alarming rate. In Canada, over 747,000 individuals were living with cognitive impairment as of 2015, and that number is rising rapidly.1 By 2050, nearly 1.8 million Canadians will have been affected by dementia, representing a threefold increase from 2020.2 Especially in older populations, the presence and impact of cognitive decline has become more evident, with the majority of dementia cases being identified as “mixed”. This is characterized by the coexistence of Alzheimer’s Disease (AD) and vascular disease in the brain which share several common modifiable vascular risk factors (VRFs) such as hypertension, diabetes, and obesity, and lifestyle risk factors such as smoking and social isolation.3 Regardless, the development of all neuropathologies bring forth complex sets of challenges that have yet to be fully understood. Due to the complex nature of neurological disorders, there lacks an encompassing systematic treatment once these disorders have thoroughly advanced in an individual, emphasizing the importance of understanding and researching brain function, disorder properties, and mitigation tactics.
In the absence of an effective treatment for neurodegenerative disorders, prevention offers the best solution to limiting the impact of cognitive decline on quality of life. The difficulty of detecting developing neurodegenerative diseases is that the factors that contribute to it, and the extent to which each one is significant are not well known, especially as the pathologies further manifest and become more complex. Because changes to the brain often occur as early as decades before evident cognitive impairment and other symptoms are identifiable, the ability for clinicians to identify and obviate the harm presented by neuropathologies is limited.4
Transient ischemic attacks (TIAs), characterized by minor disruptions to the blood flow in the brain resulting in sporadic symptoms, are suspected to occur at the onset of many structural and functional changes to the brain.5 In analyzing the progression of cognitive decline and neurodegeneration in individuals who have presented with TIAs, they have become incontrovertibly correlated with mid to late-life cognitive impairment, with their occurrences associated with a fourfold increase in risk of developing dementia.4 Thus, analysis of patients with recent TIAs can provide insight into the brain changes that occur prior to severe cognitive impairment, which presents the opportunity to address cognitive decline in its incipient stages.4,6
A procedure often used to diagnose neurological disorders once symptoms of cognitive changes present in patients, lumbar punctures have become increasingly common, with nearly 100,000 procedures in the United States in 2018.7 This procedure is characterized by the insertion of a needle into the subarachnoid space within the spinal canal to draw samples of cerebrospinal fluid (CSF) which contain protein biomarkers suspected to be associated with dementia and similar neurological disorders.8 Notably, abnormal concentrations of phosphorylated tau (p-tau), total tau (t-tau), amyloid-β 1-42 (Aβ42), and amyloid-β 1-40 (Aβ40) have been determined to be correlated to AD and related dementias.9,10 Tau proteins play an integral role in stabilizing neuron morphology, which explain how changes in protein structure and concentration can have an impact on cognitive function.8 In AD patients, tau has been predicted to be three to four times more phosphorylated than in healthy individuals, which ultimately depresses its activity and results in greater tau production.9 As a result, higher concentrations of both p-tau and t-tau have been associated with the onset of AD and related dementias, particularly impacting memory function.10,11 In the case of amyloid-β peptides, the development of Aβ42 senile plaques in the brain are known to be detrimental to brain function, and their presences are notable hallmarks of AD and related dementias.12 This occurrence is identifiable in CSF samples as cognitively impaired individuals will exhibit lower Aβ42 CSF concentrations as the proteins accumulate as plaques in brain tissue.13,14 Changes to Aβ40 concentrations are less straightforward, as studies have shown that its concentration will vary depending on the development of the disorder. 13,14Specifically, higher concentrations of Aβ40 are often detected in early stages of AD but decrease overall in later stage.16 In analyzing these four protein biomarkers, many of their ratios are also useful in assessing the extent of cognitive impairment. For instance, lower values for Aβ42 to Aβ40 ratios are suspected to coincide with steeper Aβ senile plaque accumulation, and higher values of p-tau to t-tau ratios are associated with greater rates of tau phosphorylation, which is characteristic of developing cognitive impairment.10,15,16Ultimately, the analysis of CSF proteins has proven useful in the diagnosis of neuropathologies when symptoms are identifiable, but analysis of CSF protein concentrations in individuals suspected to be at risk of cognitive impairment is limited and provides an opportunity to improve early diagnosis.
This observational study aims to discern if AD biomarker protein concentrations in CSF samples differ between TIA patients and healthy controls prior to emergence of significant cognitive decline. This work is novel, as CSF analysis may offer a potential way to identify those more at risk for AD prior to noticeable cognitive decline which usually occurs once damage has already occurred in the brain. Thus, in addressing the potential similarities in CSF protein concentrations between TIA patients and demented patients lies the potential to predict future cases of cognitive decline and improve earlier diagnosis practices for neurological disorders. To explore this idea, statistical analysis was conducted using a subset of data from TIA patients and healthy controls aged 45-75 from the University of Calgary Stroke Team: Predementia Neuroimaging of Transient Ischemic Attack (TIA) - the PREVENT Study, where participants underwent a series of assessments including a neuropsychological battery and lumbar puncture.17 Specifically, data for p-tau, t-tau, Aβ42, and Aβ40 concentrations along with their ratios were analyzed and compared between TIA patients and healthy controls to determine if statistically significant differences were present. Then, neuropsychological test scores from study participants were compared with their protein concentrations to establish if significant associations between cognitive decline symptoms and CSF protein concentrations singularly existed for TIA patients. Ultimately, this study sought to (1) determine if CSF protein concentrations varied between TIA patients and healthy controls, (2) establish if cognition is impacted by varying CSF protein levels after TIA occurrences compared to controls, and (3) ascertain the extent to which AD and related dementias can be predicted based on CSF protein biomarker concentrations in TIA patients. If CSF protein biomarker concentrations can reveal associations in TIA patients comparable to AD and related dementia trends, its usage can provide another layer of analysis that can help clinicians more accurately diagnose neurodegenerative disorders.
Method
1. PREVENT Study
The data used to conduct this observational study was collated from the longitudinal University of Calgary Stroke Team: Predementia Neuroimaging of Transient Ischemic Attack (TIA) - the PREVENT Study,which aims to improve the diagnosis of dementia and help measure the effectiveness of future treatments by observing whole-brain atrophy rates alongside neuropsychological, physiological, and genetic factors.4Specifically, this study aimed to (1) determine whether high rates of whole brain and hippocampal atrophy can be detected in non-demented TIA patients across a 60 month period following the occurrence of a TIA, (2) determine which in vivo biomarkers of AD and cerebral small vessel disease are predictive of progressive brain atrophy, and (3) determine cognitive decline in TIA patients vs controls across a 60-month period.17
The study population consisted of a total of 524 participants aged 45-75 inclusive: 286 non-demented TIA patients and 238 healthy controls. TIA participants were recruited from suitable TIA patients from the Calgary Stroke Prevention Clinic, and those who had participated in the previous Extended CATCH study.17Individuals were deemed suitable if their symptoms were highly suspicious of a first-time TIA or second-time TIA provided that the first was nondisabling, and if the individuals were not demented as per Clinical Dementia Rating (CDR) ratings (0-0.5).17 From this, age-matched healthy controls were recruited by approaching the spouses, relatives, and friends of TIA participants, as well as by advertising participation through posters.
At study entry, baseline evaluation included a clinical review, fasting cholesterol, glucose, and renal function tests. In the analysis of external elements that could influence cognition, potential covariates such as hypertension, diabetes mellitus, and hyperlipidemia were recorded, and any necessary treatments were determined. APOE genotyping was conducted from patient blood samples, and brain MRI image sequences were taken for baseline comparison with reassessments at 12 months, 3 years, and 5 years. Specifically, high-resolution T1-weighted whole-brain scans, diffusion-weighted imaging (DWI) scans, and fluid-attenuated inversion recovery (FLAIR) scans were taken to analyze hippocampal and whole brain atrophy measurements, and hyperintense spots and infarcts. Each individual also participated in a detailed neuropsychological battery (within 10 days of TIA occurrence for TIA patients), which included assessments of language, executive function, processing speed, and episodic memory. More specifically, the Montreal Cognitive Assessments (MoCA) and Addenbrooke’s Cognitive Examination – ACE-R were conducted and more thoroughly analyzed, due to their scope yet specificity in examining cognitive impairment.17 Lastly, 82 participants (43 TIA patients and 39 controls) volunteered to undergo lumbar punctures to collect cerebrospinal fluid (CSF) used to analyze p-tau, t-tau, Aβ42, and Aβ40 protein concentrations. Follow-up assessments occurred after 12 months, 3 years, and 5 years, where MRI scans were retaken, blood samples were reobtained and analyzed, and cognitive impairment was reassessed with the cognitive tests.
2. Statistical Analyses
For PREVENT Study participants who volunteered for the lumbar puncture, CSF protein concentration values of p-tau, t-tau, Aβ42, and Aβ40, MoCA and ACE-R cognitive test results closest to the lumbar puncture date, and demographic information (i.e. age, sex, cohort) were analyzed. Patients missing any of p-tau, t-tau, or Aβ42 protein concentrations were excluded from the data set, while those missing Aβ40 were not. Using SPSS Statistics for Mac, version 30 (IBM Corp; Armonk, NY, 2024), summary descriptives were assessed, establishing the frequencies of treatment groups and sex, and the sample mean and standard deviation of ages, p-tau, t-tau, Aβ42, Aβ40, MoCA, and ACE-R results. Differences in CSF protein concentrations and cognitive test scores between TIA patients and healthy controls were established using one-sided independent t-tests, comparing sample statistics under the alternate hypothesis that TIA patients would present with higher p-tau, t-tau, and Aβ40, and lower Aβ42 concentrations. In addition to the hypothesis tests conducted on the individual protein concentrations, the statistical significances of amyloid-tau indices (ATIs) as well as the ratios of Aβ42/Aβ40*10, t-tau/Aβ42, and p-tau/Aβ42 were also assessed. For all metrics, 95% confidence intervals and one-sided p values were determined with a significance level of α = 0.05. Linear regression models were performed following the t-tests to assess the likelihood that group status (TIA vs. healthy control) influenced differing CSF protein concentrations, recording the significance, t, and unstandardized B values when age and group status were controlled. For all tests, p-values up to 0.01 greater than the 0.05 threshold were deemed marginally significant, given the small sample sizes from which CSF samples were collected. Lastly, linear regressions were conducted to better establish associations between differing CSF protein concentrations and cognitive test scores, attempting to use CSF protein concentrations and ratios to predict cognitive test results closest to the times of the procedures.
Research
1. Neurological Disorder Prevalence
As societies have developed throughout the epidemiological transition model, the onset of neurological disorders has increased. Specifically, these disorders were responsible for approximately 10 million deaths worldwide in 2019.19 Notably, stroke is a leading cause in a decrease in disability-adjusted life years (DALYs), with other causes including Alzheimer’s Disease (AD), Parkinson’s Disease, dementia, and meningitis.18,19Focusing in on Canada, where technological advancements have made neurological disorders more common than infections and other chronic disorders, nearly 600,000 individuals were estimated to be living with a form of dementia.2 This value is also estimated to increase to over 1.7 million by 2050, illustrating the developing prevalence of these disorders.2
At a regional level, North America, and Western and Eastern Europe were found to have the highest incidence rates of neurological disorders in 2019.20 This is consistent with levels of technological developments within the health industry, as higher life expectancies generally coincide with the manifestation of such disorders. Despite this, East Asia and Central America have experienced the greatest rates of increase, particularly with regard to Alzheimer’s disease and similar dementias.21
With regard to differences between age, race, and sex cohorts, studies have revealed trends that suggest an uneven proportion of dementia patients across different cohorts. In a published manuscript summarizing demographic trends presented at the 2020 National Research Summit on Care, Services, and Supports for Persons with Dementia and Their Caregivers, Theme 1: Impact of Dementia, findings included that a larger absolute value of white Americans presented with Alzheimer’s disease and related dementias (ADRD), although Latinos and African Americans are disproportionately more likely to develop ADRD compared to white Americans.20 The potential explanations for these trends are complex; stress resulting from low socioeconomic statuses coupled with discrimination are suspected to be one of the causes.22 Irrespective of the subgroups, statistics have also suggested a higher prevalence of ADRD cases in women than in men with a 0.9 male-to-female ratio worldwide, and that ADRD proportions increase with advancing age.23 In fact, all ethnic subgroups experienced over a 30% increase in proportion of ADRD individuals between age groups 65-74 and 85 and older.22
However, regardless of variability of risk between the age, sex, and ethnic cohorts, the rising prevalence of these disorders worldwide emphasizes the importance of scientific research that can improve diagnostic processes and patient prognosis. Overall, recent rapid development in treatments for neurological disorders have increased in quality with regard to surgical, pharmacological, and interventional treatments, but the early onset of neurological disorders that cause nerve damage early in life means that patient prognosis is overall quite poor.4,18 This ultimately emphasizes the importance of preventative treatments, which requires advancements in accurate early diagnosis of cognitive decline.
2. Common Manifestations of Cognitive Decline
2.1. Alzheimer’s Disease (AD) and Related Dementias
Alzheimer’s Disease (AD) is the most common form of dementia, comprising 60-70% of diagnosed dementia cases.2 The development of AD is suspected to be 60-80% contingent on nonmodifiable genetic factors, in which more than 40 loci have been identified to be potentially significant; among those, the APOE alleles have shown to present the greatest risk in patients.25 Regardless, onset of AD physiologically is most prominently characterized by changes in amyloid-β (Aβ) and tau concentrations (See: 3.2. Cerebrospinal Fluid (CSF)) which often begin decades before observable cognitive symptoms are noticeable.4,20
The clinical spectrum of AD manifestations is quite broad, in which the process of diagnosis varies from patient to patient. More commonly, AD can be determined through the analysis of cognitive function, and is often corroborated by genetic analysis, such as analyzing cerebrospinal fluid (CSF) protein concentrations, assessing genes such as APOE, and evaluating for mutations such as PSEN1 which influence the production of Aβ proteins.27 Brain MRI or CT scans are also commonly taken, which can reveal abnormalities in brain tissues, such as white matter hyperintensities, perivascular spaces, cerebral microbleeds, and small subcortical strokes.28 Symptoms of AD include short, long, and self-perceived memory loss, loss of multitasking ability, and progressive difficulty of understanding words and forming coherent sentences among others, but because symptoms often do not present under early stages of brain atrophy, early diagnosis is more complicated.29
Another specific branch of dementia, vascular dementia refers to a decline in cognitive function resulting from vascular brain injury, resulting in impairment.29 Although symptoms are consistent with other forms of dementia such as AD, its development is primarily identifiable through brain scans that observe abnormalities in brain structure.30 The most common vascular risk factors are cardiovascular, including diabetes mellitus, hypertension, hyperlipidemia, and smoking.31 In the amplification of these vascular risk factors, outcomes include ischemic strokes, haemorrhagic strokes, and cerebral small vessel disease (CSVD), among others. Ischemic strokes are characterized by artery blockages within the brain, whereas haemorrhagic strokes involve strokes from excessive bleeding in the brain.32 CSVD is a common manifestation of vascular dementia, which is identifiable by abnormal structures in MRI and CT scans.4Specifically, the presence of white matter hyperintensities, perivascular spaces, microinfarcts, and cerebral microbleeds indicate the onset of CSVD and contribute to cognitive decline, alongside other harms.33
It is important to note that the majority of dementia cases worldwide are not strictly AD or vascular dementia or any single form of dementia; rather, cases are mixed, where a variety of risk factors contribute to a mixed dementia where patients experience cognitive decline from many areas, not limited to genetics, vascular factors, or protein concentrations.33 The most common forms of mixed dementia are characterized by the coexistence of AD and vascular dementia, which makes treatment difficult.34Addressing the number of different factors that contribute to cognitive impairment requires a focus on many separate systems, which ultimately explains why treatment is often circuitous for patients with fully-developed dementia.2
2.2. Transient Ischemic Attacks (TIAs)
Transient ischemic attacks (TIAs) are characterized by minor disruptions to the blood flow in the brain.6Compared to ischemic strokes, blood flow does not experience a complete blockage, but rather, a reduction, which most commonly results in sporadic symptoms that do not exceed 24 hours in length.4These symptoms include partial weakness and paralysis of the face, slurred speech, and dizziness, but because of the short duration of these symptoms, their occurrence was often not considered to be significant.35 However, studies have shown that TIAs are incontrovertibly correlated with mid to late-life cognitive impairment, and can predict future cognitive decline.4–6 In fact, approximately 11% of individuals who experience a TIA and are untreated within 7 days develop acute ischemic stroke, and this number increases to 18% after 90 days.35 On the whole, TIAs are predicted to precede significant changes to brain structure and function that result in AD and related dementias, so on that basis, TIAs can serve as a predictive marker for the onset of cognitive decline. Especially considering the difficulty of treating AD and related dementias once fully developed, the use of TIAs to predict early brain changes is incredibly useful in identifying cognitive decline and implementing preventative practices as early as possible.
Much of current focus on TIAs has been into practical means of diagnosis, which tend to be more difficult than more developed brain changes, notably because the magnitude of any changes are much less.6Because symptoms are short-lived, it is a less reliable means of diagnosis, so other methods such as MRI/CT brain scans tend to be more commonly used.6 For individuals who are presented with a TIA, small lesions or hyperintense spots often appear in scans, which helps support evidence of TIA occurrences. Overall, treatment for TIAs is similar to that of ischemic strokes. Considering that TIAs represent a less severe manifestation of ischemia, the application of existing knowledge in ischemic strokes is useful when addressing TIAs, including the prescription of antiplatelet agents.6
Other research has suggested that TIAs can be used to predict dementia and overall cognitive decline. Much of this evidence is suggested in analyzing trends, in which individuals who experienced minor strokes such as TIAs later gradually experienced cognitive decline leading to dementia.37 Additionally, analysis of brain scans of TIA patients shows similarities in the manifestation of AD and related dementias, as hyperintense spots identified on brain scans are similar to those that present in dementia patients.38However, any analysis into the role of other cognitive risk factors, such as genetics and cerebrospinal fluid (CSF) has been limited. Most analysis has focused on the role of vascular risk factors and physiological brain changes, which provides an opportunity to further explore the associations between TIA and AD and related dementias.
3. Current Advancements in Diagnosis
3.1. Brain Imaging Techniques
Because the development of neuropathologies begins long before symptoms are identifiable, the use of brain scans, including computer tomography (CT) and magnetic resonance imaging (MRI) scans, are incredibly useful to detect early brain changes. CT scans are characterized by the use of X-rays, which allow for a high resolution of brain scans.39 However, MRI scans, which use radio waves, better visualize contrast, which tends to be more useful in identifying hyperintense abnormalities on the brain.39 Another brain scan that is commonly coupled with either MRI or CT scans are positron emission tomography (PET) scans, which use an injected radioactive tracer to track bodily and metabolic functions. With regard to cerebrovascular diseases, PET scans are useful in identifying tumours, senile plaques (amyloid-β plaques), and other brain function abnormalities.40
In analyzing brain scans, one of the major focuses are areas that appear abnormal or hyperintense, making MRIs a top choice for analyzing demented patients. Indications of white matter hyperintensities, cerebral microbleeds, perivascular spaces, and microinfarcts, for instance, are valuable in diagnosing CSVD in predicting cognitive decline.39 The presence of senile plaques (i.e. amyloid-β plaques) can also be identified on brain imaging scans, which explains their popularity in usage to diagnose and analyze cognitive impairment in patients.14
3.2. Cerebrospinal Fluid (CSF)
Cerebrospinal fluid (CSF) is a valuable cognitive biomarker that has become increasingly common in diagnosing AD and related dementias. CSF is produced by the choroid plexus, a ventricle of the brain, and is present in intracranial and spinal compartments, largely responsible for cushioning the brain and nerves, meaning it directly interacts with the extracellular surfaces of the brain.21 Additionally, CSF plays a role in the transfer of nutrients and proteins throughout the nervous system, making it a valuable area to study with regard to cognitive impairment.21 CSF is collected most commonly via a lumbar puncture, a procedure where a needle is inserted into the subarachnoid space within the spinal canal to collect a fluid sample.22After collection, cerebrospinal fluid is a generally reliable biomarker in diagnosing acute brain conditions, including subarachnoid haemorrhage, meningitis, amyotrophic lateral sclerosis, and dementia.21 The detection of these conditions is identified largely through a composition analysis, which looks at microRNA, neurofilament light chains (NFL), and proteins, including amyloid-β peptides and tau proteins.21 However, in detecting AD and related dementias, the analysis of amyloid-β (Aβ) peptides and tau proteins is most relevant.21
Aβ peptides are cleaved from amyloid precursor proteins (APP), which are notably prevalent in the synapses of neuron cells.12 APP is largely responsible for neuronal development and signalling, but when they misfold or produce abnormal Aβ peptides, they produce Aβ senile plaques that inhibit neuronal function.12 Over the long term, Aβ peptide production increases with age, resulting in greater aggregates of senile plaques as the brain ages.10 Although the direct impact of Aβ peptides on cognitive decline is currently unknown, Aβ has been determined to be a valuable biomarker that can be used to aid the diagnosis of neurodegenerative disorders, so much so that its presence in senile plaques has become a hallmark characteristic of AD and some related dementias.12,14 The two most prevalent forms of Aβ are the 40 (Aβ 1-40/Aβ40) and 42 (Aβ 1-42/Aβ42) amino acid chains.14 The difference between Aβ40 and Aβ42 peptides is the presence of two additional C-terminal residues on the Aβ42 peptide, and this difference causes Aβ40 and Aβ42 to have very different implications on cognitive impairment.25 Specifically, while Aβ40 is much more abundant in the brain, it tends to be less common in senile plaques.25 This is largely suspected to be due to the greater tendency for Aβ42 to aggregate from having a larger molecule size, and it is for this reason that Aβ42 is generally a more valuable biomarker of cognitive impairment.25 However, Aβ40 serves as a relevant comparison to Aβ42, as lower Aβ42/Aβ40 values have been associated with steeper senile plaque accumulation and greater cognitive decline.16 Aβ42 is also a valuable biomarker irrespective of Aβ40 concentrations.14 On the whole, Aβ42 concentrations in CSF are strongly negatively correlated with the density of senile plaques in brain tissue; in other words, lower concentrations of Aβ42 in CSF samples are generally associated with higher Aβ senile plaques. This correlation has proven useful in predicting levels of cognitive impairment, given that high densities of Aβ senile plaques is an accepted characteristic of AD and related dementias. However, further research has revealed that even after accounting for this correlation, Aβ42 concentrations in CSF samples still tend to be lower in cognitively impaired individuals than normal controls, which ultimately strengthens the associations between low Aβ42 concentrations and levels of cognitive impairment. Overall, the use of Aβ as a biomarker for neurodegenerative diseases has proven useful, although studies have suggested that Aβ in isolation does not drive cognitive decline, and thus may not be sufficient in predicting the implications of cognitive impairment.10
Tau proteins are responsible for the stabilization of the cytoskeleton of neurons under standard physiological conditions.8 Specifically, tau is known to maintain the integrity of the microtubules of the neuron cytoskeleton, but mutations and structural modifications that occur with advancing age often result in neuronal dysfunction and neurodegenerative disorders, known as tauopathies.8 Unlike Aβ, the manifestations of disorders (tauopathies) caused by modified tau are known to directly influence and accelerate cognitive impairment, especially as hyperphosphorylation occurs.10 Compared to healthy controls, studies have revealed that tau is three to four more times phosphorylated in demented patients, which ultimately depresses the level of tau activity and results in greater production.9 Because of this, total tau (t-tau) and phosphorylated tau (p-tau) are valuable CSF protein biomarkers that clinicians often analyze when a patient presents with symptoms of cognitive impairment. Patients with developed cognitive impairment in the form of AD and other forms of dementia most commonly present with elevated levels of both p-tau and t-tau.11 Although the reasons for elevated p-tau levels are not fully understood, studies have revealed that a higher concentration of p-tau results in a decrease in functionality, causing a greater production of tau (t-tau) in the brain.11 This trend is identifiable in CSF samples, although in very small amounts, but nonetheless, is valuable in the diagnosis of neurodegenerative disorders.9,11
Analysis of the ratios between Aβ and tau concentrations also provides another layer of analysis in establishing cognitive impairment. For instance, the analysis of t-tau/Aβ42 can help further establish the severity of neurofibrillary tangles and Aβ senile plaques in the brain, as higher values of this ratio generally correspond with more severe cognitive decline.30 Although t-tau is individually suspected to rise with cognitive impairment alongside decreasing Aβ42 concentrations, this ratio is particularly valuable because it illustrates the interaction between the varying concentrations, which can provide clinicians with a better idea of what specific brain changes are occurring.30 Similar to the t-tau/Aβ42 ratio, p-tau/Aβ42 provides similar information about the extent of cognitive impairment based on the two CSF protein biomarkers. Although measuring similar values to the t-tau/Aβ42 ratio, the analysis of p-tau/Aβ42 is particularly useful for analyzing the severity of tau phosphorylation which is more notably associated with AD.30
When used in conjunction with each other, the analysis of tau and Aβ concentrations is powerful in predicting the extent of cognitive decline in an individual, and the expected implications of the disorder; longitudinal memory decline has been noted to decline most severely with elevated tau and Aβ concentrations, for instance.10 However, most of the analysis regarding the role of CSF biomarkers in influencing cognitive impairment has been focused on AD and related dementias, as which point cognitive impairment has already significantly developed. Research into earlier indications of cognitive decline, such as TIAs, comparatively, has not been thoroughly explored, and potentially provides the opportunity to better understand the significance of CSF protein biomarkers.4
3.3. Blood Tests
In assessing the genetic biomarkers that can contribute to cognitive impairment, blood tests are valuable for establishing nonmodifiable risk factors in understanding the manifestation of cognitive decline in individuals. Although blood tests can isolate plasma to assess Aβ, tau, and NFL, assessing genes through blood tests tend to be more popular, as the analysis of CSF samples tend to provide more valuable results.17
Among the known genetic risk factors that contribute to AD and related dementias, the apolipoprotein E (APOE) genotype is one of the most popular factors to assess. Independent of its impact on cognitive decline, the APOE genotype is responsible for producing apolipoproteins which combine lipids to regulate cholesterol levels.32 This is generally important for preventing cardiovascular diseases and vascular dementia, given APOE is the primary carrier of cholesterol in the brain. Despite this, research has revealed that the different polymorphisms of the APOE genotype tend to protect individuals from AD and related dementias, or increase their risk of cognitive decline.33 Although the reasons for the correlation are not well understood, Aβ senile plaque concentration has been observed to vary within demented individuals with different APOE polymorphisms.34 The APOE genotype presents with three different alleles: ε2 (APOE2), ε3 (APOE3), and ε4 (APOE4).34 The APOE3 allele is the most common in individuals, with a 0.779 allele frequency, while the APOE2 allele is the most rare, with a 0.084 frequency.35 Between the three alleles, the ε3 allele is known to not present with any risk or provide any protection against cognitive decline, but the ε4 allele has shown to be associated with greater densities of Aβ plaques and cognitive impairment. Specifically, research has revealed that APOE4 homozygosity is associated with the highest risk of cognitive impairment of all APOE polymorphisms, but individuals with at least one ε4 allele still present a higher risk of dementia than other individuals.4 Comparatively, the rarer ε2 allele is suspected to protect against cognitive decline.34 In clinical practice, the APOE4 alleles are of greatest focus and are most valuable in assessing cognitive impairment risk. Although APOE cannot be used to independently diagnose dementia, it is a valuable predictor that can corroborate other evidence relating to cognitive impairment onset.
Data
**Copy and paste errors have impacted the table borders making reading them more difficult and ambiguous. My deepest apologies for this inconvenience. For better table formatting and more comprehensive results, see the attached results file.
1. Descriptive/Frequency analysis
|
CSF protein descriptives by group status |
|||||
|
|
C/T |
N |
Mean |
Std. Deviation |
Std. Error Mean |
|
t-tau (ng/L) |
Control |
36 |
321.7517 |
170.3032 |
28.3839 |
|
Treatment |
34 |
435.2476 |
208.9591 |
35.8362 |
|
|
p-tau (ng/L) |
Control |
36 |
41.9796 |
17.8808 |
2.9801 |
|
Treatment |
34 |
56.2664 |
28.0555 |
4.8115 |
|
|
Aβ 1-42 (ng/L) |
Control |
36 |
980.5417 |
301.7020 |
50.2837 |
|
Treatment |
34 |
855.0288 |
261.6819 |
44.8781 |
|
|
Aβ 1-40 (ng/L) |
Control |
34 |
10103.0000 |
2396.7141 |
411.0331 |
|
Treatment |
20 |
10382.5500 |
2646.0091 |
591.6656 |
|
|
Aβ42/Aβ40*10 |
Control |
34 |
.9889 |
.2599 |
.0446 |
|
Treatment |
20 |
.8842 |
.2654 |
.0593 |
|
|
t-tau/Aβ42 |
Control |
36 |
.3692 |
.2655 |
.0442 |
|
Treatment |
34 |
.5988 |
.4470 |
.0767 |
|
|
p-tau/Aβ42 |
Control |
36 |
.0476 |
.0309 |
.0052 |
|
Treatment |
34 |
.0780 |
.0642 |
.0110 |
|
|
Amyloid-Tau Index (ATI) |
Control |
36 |
1.6972 |
.5767 |
.0961 |
|
Treatment |
34 |
1.2653 |
.5464 |
.0937 |
|
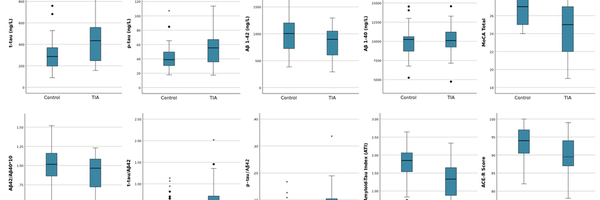
Looking purely at the summary statistics regarding the CSF protein concentrations and ratios, when divided based on group status, I could identify trends in the data by analyzing the mean and standard deviation statistics for each metric. For the four protein concentrations listed in the top four rows, both t-tau and p-tau concentrations were elevated in the TIA group compared with healthy controls, the Aβ42 concentrations were depressed in TIA individuals, and the Aβ40 concentrations were roughly the same. Perhaps not coincidentally, the trends illustrated with these concentrations are consistent with trends when comparing demented with healthy individuals, which tends to suggest consistencies and relationships between protein concentrations between TIA and demented individuals in the earliest forms of cognitive decline. The four protein ratios that were conducted also revealed greater levels of cognitive decline in trends, attributable to the fact that the individual proteins exhibited those trends.
|
Cognitive assessment descriptives by groups status |
|||||
|
|
C/T |
N |
Mean |
Std. Deviation |
Std. Error Mean |
|
MoCA Total |
Control |
35 |
26.60 |
1.850 |
.313 |
|
TIA |
33 |
24.85 |
3.043 |
.530 |
|
|
ACE-R Score |
Control |
35 |
93.06 |
4.935 |
.834 |
|
TIA |
32 |
89.56 |
6.470 |
1.144 |
|
The summary statistics addressing the two cognitive tests analyzed are also consistent with trends exhibited in demented individuals, with overall lower scores for both tests in the TIA group when compared with healthy controls. Once again, the trends presented in this data suggest similarities between TIA individuals and healthy controls; ultimately, suggesting that CSF protein concentrations play some role in the earliest stages of cognitive decline.
2. Independent samples t tests
|
|
Levene's Test for Equality of Variances |
t-test for Equality of Means |
|||||||||
|
t |
df |
Significance |
Mean Difference |
Std. Error Difference |
95% Confidence Interval of the Difference |
||||||
|
F |
Sig. |
One-Sided |
Two-Sided |
Lower |
Upper |
||||||
|
t-tau (ng/L) |
Equal variances assumed |
2.5909 |
.1121 |
-2.4972 |
68.0000 |
.0075 |
.0149 |
-113.4960 |
45.4485 |
-204.1871 |
-22.8049 |
|
Equal variances not assumed |
|
|
-2.4827 |
63.7399 |
.0078 |
.0157 |
-113.4960 |
45.7152 |
-204.8297 |
-22.1623 |
|
|
p-tau (ng/L) |
Equal variances assumed |
4.6490 |
.0346 |
-2.5554 |
68.0000 |
.0064 |
.0128 |
-14.2869 |
5.5908 |
-25.4431 |
-3.1307 |
|
Equal variances not assumed |
|
|
-2.5243 |
55.4781 |
.0072 |
.0145 |
-14.2869 |
5.6596 |
-25.6269 |
-2.9469 |
|
|
Aβ 1-42 (ng/L) |
Equal variances assumed |
.6730 |
.4149 |
1.8546 |
68.0000 |
.0340 |
.0680 |
125.5128 |
67.6748 |
-9.5300 |
260.5557 |
|
Equal variances not assumed |
|
|
1.8623 |
67.5250 |
.0335 |
.0669 |
125.5128 |
67.3980 |
-8.9949 |
260.0206 |
|
|
Aβ 1-40 (ng/L) |
Equal variances assumed |
.0443 |
.8342 |
-.3983 |
52.0000 |
.3460 |
.6920 |
-279.5500 |
701.8808 |
-1687.9769 |
1128.8769 |
|
Equal variances not assumed |
|
|
-.3880 |
36.8263 |
.3501 |
.7002 |
-279.5500 |
720.4279 |
-1739.5081 |
1180.4081 |
|
Independent samples t tests were run after the descriptive analysis to determine statistically significant differences in the protein concentrations and ratios and cognitive assessment scores when comparing healthy individuals (controls) with TIA patients. Equal variances were assumed for all metrics, and one-sided P-values were used, considering that very specific trends were anticipated when comparing the two groups (e.g. higher tau concentrations, lower Aβ42 concentrations). For the p-tau, t-tau, and Aβ42 concentrations, statistically significance was determined given the significance values (P-values) listed in the sixth column were below the significance level of 0.05. Aβ40 concentrations, with a P-value of 0.3460, was not statistically significant.
|
Independent samples t test for CSF protein ratios between TIA and healthy control groups |
|||||||||||
|
|
Levene's Test for Equality of Variances |
t-test for Equality of Means |
|||||||||
|
t |
df |
Significance |
Mean Difference |
Std. Error Difference |
95% Confidence Interval of the Difference |
||||||
|
F |
Sig. |
One-Sided |
Two-Sided |
Lower |
Upper |
||||||
|
Aβ42/ Aβ40*10 |
Equal variances assumed |
.0029 |
.9571 |
1.4186 |
52.0000 |
.0810 |
.1620 |
.1047 |
.0738 |
-.0434 |
.2528 |
|
Equal variances not assumed |
|
|
1.4108 |
39.2867 |
.0831 |
.1662 |
.1047 |
.0742 |
-.0454 |
.2548 |
|
|
t-tau/Aβ42 |
Equal variances assumed |
6.2488 |
.0148 |
-2.6297 |
68.0000 |
.0053 |
.0106 |
-.2296 |
.0873 |
-.4038 |
-.0554 |
|
Equal variances not assumed |
|
|
-2.5934 |
53.0912 |
.0061 |
.0123 |
-.2296 |
.0885 |
-.4071 |
-.0520 |
|
|
p-tau/Aβ42 |
Equal variances assumed |
8.7320 |
.0043 |
-2.5433 |
68.0000 |
.0066 |
.0133 |
-.0304 |
.0119 |
-.0542 |
-.0065 |
|
Equal variances not assumed |
|
|
-2.4977 |
46.9239 |
.0080 |
.0161 |
-.0304 |
.0122 |
-.0548 |
-.0059 |
|
|
Amyloid-Tau Index (ATI) |
Equal variances assumed |
.0045 |
.9465 |
3.2124 |
68.0000 |
.0010 |
.0020 |
.4319 |
.1344 |
.1636 |
.7002 |
|
Equal variances not assumed |
|
|
3.2174 |
67.9988 |
<.001 |
.0020 |
.4319 |
.1342 |
.1640 |
.6998 |
|
When running the significance tests for the protein ratios, statistical significance was established for all ratios except for the Aβ42/Αβ40*10 ratio, with special notice to the ATI with an incredibly low P-value of 0.001. The results of these t tests collectively suggest that because there are differences in the protein concentrations and ratios between the two groups attributable to some factor other than chance, the CSF proteins are valuable to analyze and understand in TIA patients in the earliest stages of cognitive decline, especially with tau proteins which established statistical significance across all proteins and ratios. The lack of statistically significant evidence for the Aβ40 and Aβ42/Αβ40*10 metrics tends to suggest that the Aβ peptides do not play as significant of a role in cognitive decline in early strokes that precede more significant cognitive changes; rather, while the tau proteins reflect changes earlier on, the Aβ peptide trends present later in individuals once more significant cognitive changes have already occurred.
|
Independent samples t test for cognitive test scores between TIA and healthy control groups |
|||||||||||
|
|
Levene's Test for Equality of Variances |
t-test for Equality of Means |
|||||||||
|
t |
df |
Significance |
Mean Difference |
Std. Error Difference |
95% Confidence Interval of the Difference |
||||||
|
F |
Sig. |
One-Sided |
Two-Sided |
Lower |
Upper |
||||||
|
MoCA Total |
Equal variances assumed |
9.691 |
.003 |
2.887 |
66 |
.003 |
.005 |
1.752 |
.607 |
.540 |
.2963 |
|
Equal variances not assumed |
|
|
2.848 |
52.229 |
.003 |
.006 |
1.752 |
.615 |
.517 |
2.986 |
|
|
ACE-R Score |
Equal variances assumed |
1.056 |
.308 |
2.498 |
65 |
.008 |
.015 |
3.495 |
1.399 |
.701 |
6.288 |
|
Equal variances not assumed |
|
|
2.469 |
57.826 |
.008 |
.017 |
3.495 |
1.416 |
.661 |
6.329 |
|
The last set of data that was run with the t tests was the cognitive data from the MoCA and ACE-R test scores. Also assuming equal variance, statistical significance was established for both tests, with significance values of less than 0.05 and even less than 0.01. With P-values suggesting that there is less than a 1% probability that these results could occur by chance if there was really no difference between the groups, the test confidently concludes that like many of the CSF metrics, differences in the test scores is attributable to some factor other than chance, and that the magnitude and impact of cognitive changes presents in early strokes.
3. Linear Regressions (pt. 1)
|
Coefficientsa |
||||||
|
Model |
Unstandardized Coefficients |
Standardized Coefficients |
t |
Sig. |
||
|
B |
Std. Error |
Beta |
||||
|
1 |
(Constant) |
-113.365 |
151.341 |
|
-.749 |
.456 |
|
Age |
6.840 |
2.332 |
.330 |
2.933 |
.005 |
|
|
C/T |
85.889 |
44.118 |
.219 |
1.947 |
.056 |
|
|
a. Dependent Variable: t-tau (ng/L) |
||||||
|
Coefficientsa |
||||||
|
Model |
Unstandardized Coefficients |
Standardized Coefficients |
t |
Sig. |
||
|
B |
Std. Error |
Beta |
||||
|
1 |
(Constant) |
-2.346 |
18.989 |
|
-.124 |
.902 |
|
Age |
.697 |
.293 |
.273 |
2.382 |
.020 |
|
|
C/T |
11.475 |
5.535 |
.238 |
2.073 |
.042 |
|
|
a. Dependent Variable: p-tau (ng/L) |
||||||
|
Coefficientsa |
||||||
|
Model |
Unstandardized Coefficients |
Standardized Coefficients |
t |
Sig. |
||
|
B |
Std. Error |
Beta |
||||
|
1 |
(Constant) |
1516.603 |
229.873 |
|
6.598 |
<.001 |
|
Age |
-8.427 |
3.542 |
-.279 |
-2.379 |
.020 |
|
|
C/T |
-91.501 |
67.011 |
-.160 |
-1.365 |
.177 |
|
|
a. Dependent Variable: Aβ 1-42 (ng/L) |
||||||
|
Coefficientsa |
||||||
|
Model |
Unstandardized Coefficients |
Standardized Coefficients |
t |
Sig. |
||
|
B |
Std. Error |
Beta |
||||
|
1 |
(Constant) |
9101.132 |
2424.743 |
|
3.753 |
<.001 |
|
Age |
15.618 |
37.199 |
.061 |
.420 |
.676 |
|
|
C/T |
195.946 |
734.994 |
.039 |
.267 |
.791 |
|
|
a. Dependent Variable: Aβ 1-40 (ng/L) |
||||||
|
Coefficientsa |
||||||
|
Model |
Unstandardized Coefficients |
Standardized Coefficients |
t |
Sig. |
||
|
B |
Std. Error |
Beta |
||||
|
1 |
(Constant) |
1.514 |
.244 |
|
6.202 |
<.001 |
|
Age |
-.008 |
.004 |
-.298 |
-2.187 |
.033 |
|
|
C/T |
-.061 |
.074 |
-.112 |
-.822 |
.415 |
|
|
a. Dependent Variable: Aβ42/Aβ40*10 |
||||||
|
Coefficientsa |
||||||
|
Model |
Unstandardized Coefficients |
Standardized Coefficients |
t |
Sig. |
||
|
B |
Std. Error |
Beta |
||||
|
1 |
(Constant) |
-.715 |
.278 |
|
-2.577 |
.012 |
|
Age |
.017 |
.004 |
.427 |
3.986 |
<.001 |
|
|
C/T |
.161 |
.081 |
.213 |
1.986 |
.051 |
|
|
a. Dependent Variable: t-tau/Aβ42 |
||||||
|
Coefficientsa |
||||||
|
Model |
Unstandardized Coefficients |
Standardized Coefficients |
t |
Sig. |
||
|
B |
Std. Error |
Beta |
||||
|
1 |
(Constant) |
-.078 |
.039 |
|
-1.985 |
.051 |
|
Age |
.002 |
.001 |
.362 |
3.264 |
.002 |
|
|
C/T |
.022 |
.011 |
.217 |
1.959 |
.054 |
|
|
a. Dependent Variable: p-tau/Aβ42 |
||||||
|
Coefficientsa |
||||||
|
Model |
Unstandardized Coefficients |
Standardized Coefficients |
t |
Sig. |
||
|
B |
Std. Error |
Beta |
||||
|
1 |
(Constant) |
3.365 |
.428 |
|
7.866 |
<.001 |
|
Age |
-.026 |
.007 |
-.417 |
-3.978 |
<.001 |
|
|
C/T |
-.326 |
.125 |
-.274 |
-2.615 |
.011 |
|
|
a. Dependent Variable: Amyloid-Tau Index (ATI) |
||||||
|
Coefficientsa |
||||||
|
Model |
Unstandardized Coefficients |
Standardized Coefficients |
t |
Sig. |
||
|
B |
Std. Error |
Beta |
||||
|
1 |
(Constant) |
31.216 |
2.062 |
|
15.139 |
<.001 |
|
C/T |
-1.491 |
.599 |
-.285 |
-2.489 |
.015 |
|
|
Age |
-.072 |
.032 |
-.262 |
-2.284 |
.026 |
|
|
a. Dependent Variable: MoCA Total |
||||||
|
Coefficientsa |
||||||
|
Model |
Unstandardized Coefficients |
Standardized Coefficients |
t |
Sig. |
||
|
B |
Std. Error |
Beta |
||||
|
1 |
(Constant) |
108.516 |
4.562 |
|
23.787 |
<.001 |
|
Age |
-.242 |
.070 |
-.384 |
-3.456 |
<.001 |
|
|
C/T |
-2.719 |
1.313 |
-.230 |
-2.070 |
.042 |
|
|
a. Dependent Variable: ACE-R Score |
||||||
In order to advance understandings as to how differing CSF protein concentrations and ratios and cognitive assessment scores are related to TIA occurrences, linear regressions were conducted to establish the extent to which group status could be used to predict higher or lower protein concentrations and cognitive test scores. These regressions were conducted with group status (having a TIA or being healthy) and age as potential predictors for each protein concentration, ratio, and each test score. The significance values (P-values) in the right most columns represent how strong the regressions are in predicting the output variables. Looking at the four protein concentrations, p-tau was the only outcome that could be significantly predicted by group status when looking at the significance values in the "C/T" row. For the protein ratios, the ATI was statistically significant while the other metrics were not, although the p-tau/Aβ42 and t-tau/Aβ42 had P-values just larger than the 0.05 threshold. Both cognitive assessments had P-values lower than 0.05, establishing statistically significant linear regressions. However, in looking at the strength of the other predictor, age, all metrics yielded more statistically significant regressions for age as a predictor as compared to group status, suggesting that these linear regressions are not particularly strong predictors of higher or lower concentrations and test scores, even for statistically significant values.
4. Linear regressions (pt. 2)
|
Coefficientsa |
||||||
|
Model |
Unstandardized Coefficients |
Standardized Coefficients |
t |
Sig. |
||
|
B |
Std. Error |
Beta |
||||
|
1 |
(Constant) |
31.109 |
2.078 |
|
14.973 |
<.001 |
|
Age |
-.065 |
.034 |
-.236 |
-1.934 |
.058 |
|
|
C/T |
-1.402 |
.617 |
-.268 |
-2.272 |
.026 |
|
|
t-tau (ng/L) |
-.001 |
.002 |
-.081 |
-.653 |
.516 |
|
|
a. Dependent Variable: MoCA Total |
||||||
|
Coefficientsa |
||||||
|
Model |
Unstandardized Coefficients |
Standardized Coefficients |
t |
Sig. |
||
|
B |
Std. Error |
Beta |
||||
|
1 |
(Constant) |
31.213 |
2.077 |
|
15.029 |
<.001 |
|
Age |
-.070 |
.033 |
-.253 |
-2.112 |
.039 |
|
|
C/T |
-1.453 |
.621 |
-.278 |
-2.340 |
.022 |
|
|
p-tau (ng/L) |
-.003 |
.013 |
-.032 |
-.259 |
.796 |
|
|
a. Dependent Variable: MoCA Total |
||||||
|
Coefficientsa |
||||||
|
Model |
Unstandardized Coefficients |
Standardized Coefficients |
t |
Sig. |
||
|
B |
Std. Error |
Beta |
||||
|
1 |
(Constant) |
32.070 |
2.673 |
|
11.997 |
<.001 |
|
Age |
-.077 |
.033 |
-.279 |
-2.321 |
.023 |
|
|
C/T |
-1.546 |
.612 |
-.296 |
-2.526 |
.014 |
|
|
Aβ 1-42 (ng/L) |
-.001 |
.001 |
-.061 |
-.506 |
.615 |
|
|
a. Dependent Variable: MoCA Total |
||||||
|
Coefficientsa |
||||||
|
Model |
Unstandardized Coefficients |
Standardized Coefficients |
t |
Sig. |
||
|
B |
Std. Error |
Beta |
||||
|
1 |
(Constant) |
31.965 |
2.603 |
|
12.281 |
<.001 |
|
Age |
-.047 |
.035 |
-.179 |
-1.319 |
.193 |
|
|
C/T |
-1.153 |
.700 |
-.223 |
-1.647 |
.106 |
|
|
Aβ 1-40 (ng/L) |
.000 |
.000 |
-.240 |
-1.817 |
.075 |
|
|
a. Dependent Variable: MoCA Total |
||||||
|
Coefficientsa |
||||||
|
Model |
Unstandardized Coefficients |
Standardized Coefficients |
t |
Sig. |
||
|
B |
Std. Error |
Beta |
||||
|
1 |
(Constant) |
29.056 |
3.159 |
|
9.196 |
<.001 |
|
Age |
-.046 |
.038 |
-.178 |
-1.211 |
.232 |
|
|
C/T |
-1.169 |
.727 |
-.227 |
-1.607 |
.115 |
|
|
Aβ42/Aβ40*10 |
.470 |
1.351 |
.050 |
.348 |
.729 |
|
|
a. Dependent Variable: MoCA Total |
||||||
|
Coefficientsa |
||||||
|
Model |
Unstandardized Coefficients |
Standardized Coefficients |
t |
Sig. |
||
|
B |
Std. Error |
Beta |
||||
|
1 |
(Constant) |
30.822 |
2.172 |
|
14.188 |
<.001 |
|
Age |
-.063 |
.035 |
-.228 |
-1.778 |
.080 |
|
|
C/T |
-1.403 |
.620 |
-.268 |
-2.263 |
.027 |
|
|
t-tau/Aβ42 |
-.545 |
.902 |
-.080 |
-.604 |
.548 |
|
|
a. Dependent Variable: MoCA Total |
||||||
|
Coefficientsa |
||||||
|
Model |
Unstandardized Coefficients |
Standardized Coefficients |
t |
Sig. |
||
|
B |
Std. Error |
Beta |
||||
|
1 |
(Constant) |
30.999 |
2.136 |
|
14.511 |
<.001 |
|
Age |
-.067 |
.034 |
-.242 |
-1.947 |
.056 |
|
|
C/T |
-1.429 |
.620 |
-.273 |
-2.303 |
.025 |
|
|
p-tau/Aβ42 |
-2.745 |
6.395 |
-.055 |
-.429 |
.669 |
|
|
a. Dependent Variable: MoCA Total |
||||||
|
Coefficientsa |
||||||
|
Model |
Unstandardized Coefficients |
Standardized Coefficients |
t |
Sig. |
||
|
B |
Std. Error |
Beta |
||||
|
1 |
(Constant) |
31.360 |
2.860 |
|
10.965 |
<.001 |
|
Age |
-.073 |
.035 |
-.266 |
-2.076 |
.042 |
|
|
C/T |
-1.505 |
.633 |
-.288 |
-2.379 |
.020 |
|
|
Amyloid-Tau Index (ATI) |
-.043 |
.586 |
-.010 |
-.073 |
.942 |
|
|
a. Dependent Variable: MoCA Total |
||||||
|
Coefficientsa |
||||||
|
Model |
Unstandardized Coefficients |
Standardized Coefficients |
t |
Sig. |
||
|
B |
Std. Error |
Beta |
||||
|
1 |
(Constant) |
108.309 |
4.595 |
|
23.571 |
<.001 |
|
Age |
-.227 |
.074 |
-.361 |
-3.060 |
.003 |
|
|
C/T |
-2.534 |
1.352 |
-.215 |
-1.874 |
.066 |
|
|
t-tau (ng/L) |
-.002 |
.004 |
-.076 |
-.633 |
.529 |
|
|
a. Dependent Variable: ACE-R Score |
||||||
|
Coefficientsa |
||||||
|
Model |
Unstandardized Coefficients |
Standardized Coefficients |
t |
Sig. |
||
|
B |
Std. Error |
Beta |
||||
|
1 |
(Constant) |
108.539 |
4.582 |
|
23.690 |
<.001 |
|
Age |
-.256 |
.073 |
-.406 |
-3.496 |
<.001 |
|
|
C/T |
-2.937 |
1.358 |
-.249 |
-2.163 |
.034 |
|
|
p-tau (ng/L) |
.019 |
.029 |
.080 |
.676 |
.502 |
|
|
a. Dependent Variable: ACE-R Score |
||||||
|
Coefficientsa |
||||||
|
Model |
Unstandardized Coefficients |
Standardized Coefficients |
t |
Sig. |
||
|
B |
Std. Error |
Beta |
||||
|
1 |
(Constant) |
108.994 |
5.855 |
|
18.615 |
<.001 |
|
Age |
-.245 |
.073 |
-.389 |
-3.338 |
.001 |
|
|
C/T |
-2.748 |
1.342 |
-.233 |
-2.048 |
.045 |
|
|
Aβ 1-42 (ng/L) |
.000 |
.002 |
-.015 |
-.132 |
.896 |
|
|
a. Dependent Variable: ACE-R Score |
||||||
|
Coefficientsa |
||||||
|
Model |
Unstandardized Coefficients |
Standardized Coefficients |
t |
Sig. |
||
|
B |
Std. Error |
Beta |
||||
|
1 |
(Constant) |
107.989 |
6.076 |
|
17.774 |
<.001 |
|
Age |
-.202 |
.082 |
-.320 |
-2.446 |
.018 |
|
|
C/T |
-3.410 |
1.633 |
-.273 |
-2.088 |
.042 |
|
|
Aβ 1-40 (ng/L) |
.000 |
.000 |
-.079 |
-.624 |
.536 |
|
|
a. Dependent Variable: ACE-R Score |
||||||
|
Coefficientsa |
||||||
|
Model |
Unstandardized Coefficients |
Standardized Coefficients |
t |
Sig. |
||
|
B |
Std. Error |
Beta |
||||
|
1 |
(Constant) |
103.291 |
7.143 |
|
14.461 |
<.001 |
|
Age |
-.188 |
.086 |
-.299 |
-2.183 |
.034 |
|
|
C/T |
-3.322 |
1.644 |
-.266 |
-2.020 |
.049 |
|
|
Aβ42/Aβ40*10 |
1.918 |
3.054 |
.085 |
.628 |
.533 |
|
|
a. Dependent Variable: ACE-R Score |
||||||
|
Coefficientsa |
||||||
|
Model |
Unstandardized Coefficients |
Standardized Coefficients |
t |
Sig. |
||
|
B |
Std. Error |
Beta |
||||
|
1 |
(Constant) |
107.889 |
4.780 |
|
22.569 |
<.001 |
|
Age |
-.227 |
.078 |
-.360 |
-2.921 |
.005 |
|
|
C/T |
-2.575 |
1.357 |
-.218 |
-1.898 |
.062 |
|
|
t-tau/Aβ42 |
-.934 |
1.990 |
-.059 |
-.469 |
.640 |
|
|
a. Dependent Variable: ACE-R Score |
||||||
|
Coefficientsa |
||||||
|
Model |
Unstandardized Coefficients |
Standardized Coefficients |
t |
Sig. |
||
|
B |
Std. Error |
Beta |
||||
|
1 |
(Constant) |
108.823 |
4.716 |
|
23.074 |
<.001 |
|
Age |
-.250 |
.076 |
-.397 |
-3.305 |
.002 |
|
|
C/T |
-2.809 |
1.359 |
-.238 |
-2.067 |
.043 |
|
|
p-tau/Aβ42 |
4.044 |
13.998 |
.036 |
.289 |
.774 |
|
|
a. Dependent Variable: ACE-R Score |
||||||
|
Coefficientsa |
||||||
|
Model |
Unstandardized Coefficients |
Standardized Coefficients |
t |
Sig. |
||
|
B |
Std. Error |
Beta |
||||
|
1 |
(Constant) |
107.452 |
6.248 |
|
17.198 |
<.001 |
|
Age |
-.234 |
.078 |
-.372 |
-3.015 |
.004 |
|
|
C/T |
-2.618 |
1.383 |
-.222 |
-1.893 |
.063 |
|
|
Amyloid-Tau Index (ATI) |
.323 |
1.285 |
.032 |
.251 |
.802 |
|
|
a. Dependent Variable: ACE-R Score |
||||||
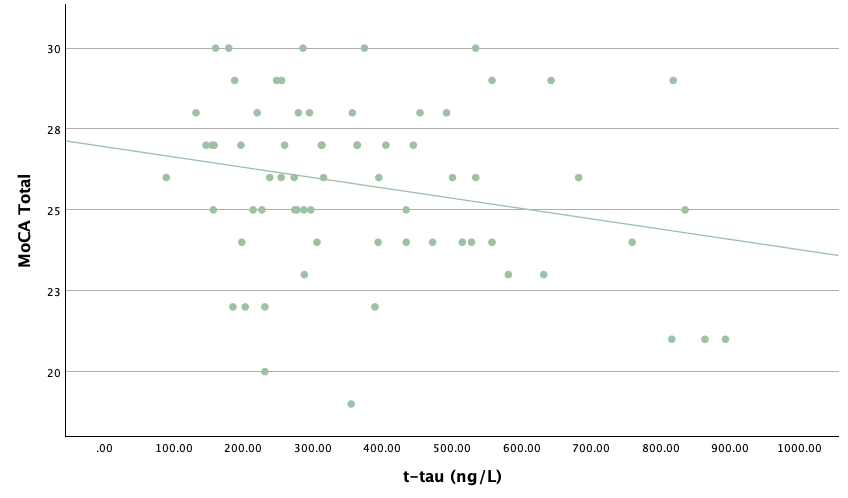
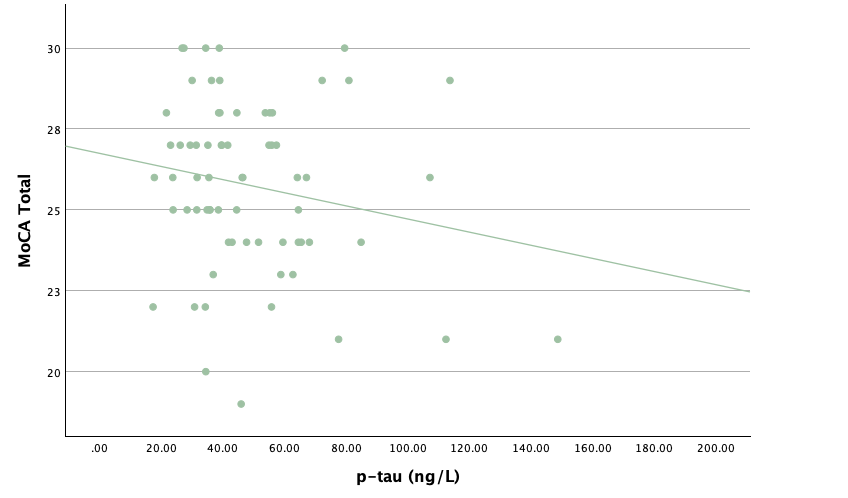
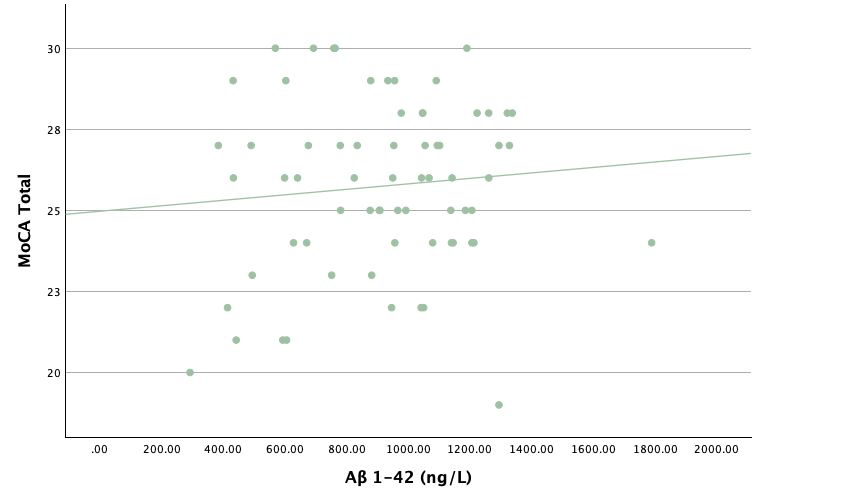
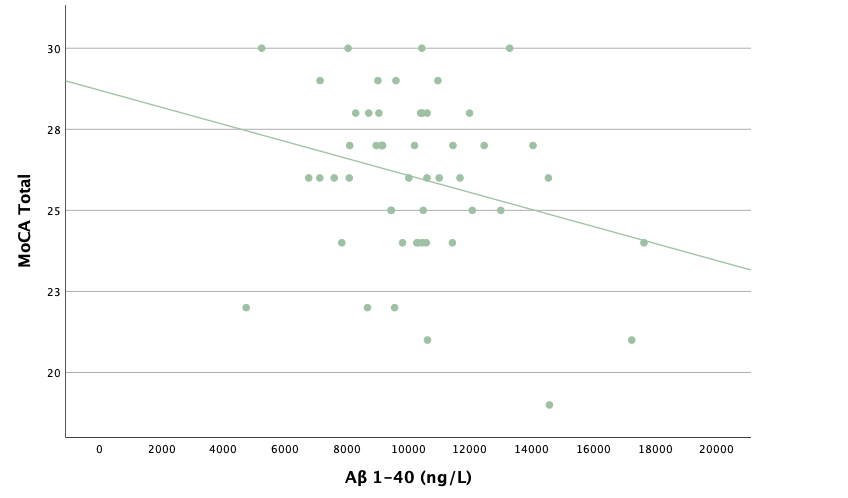
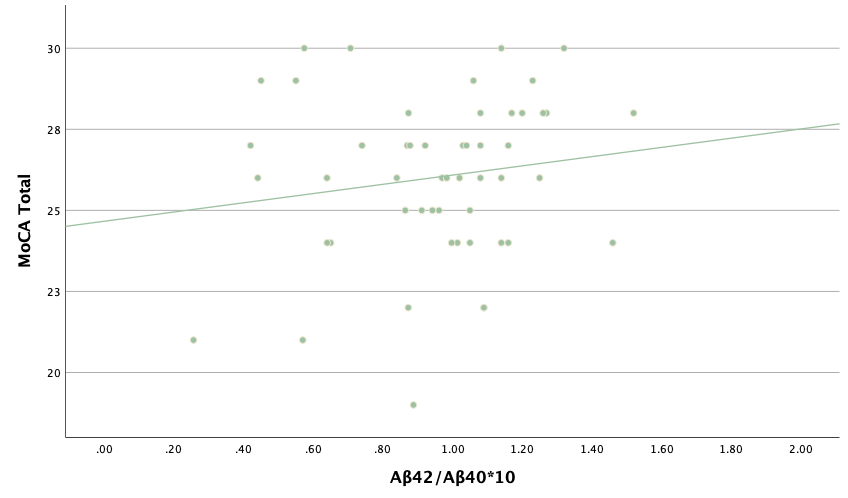
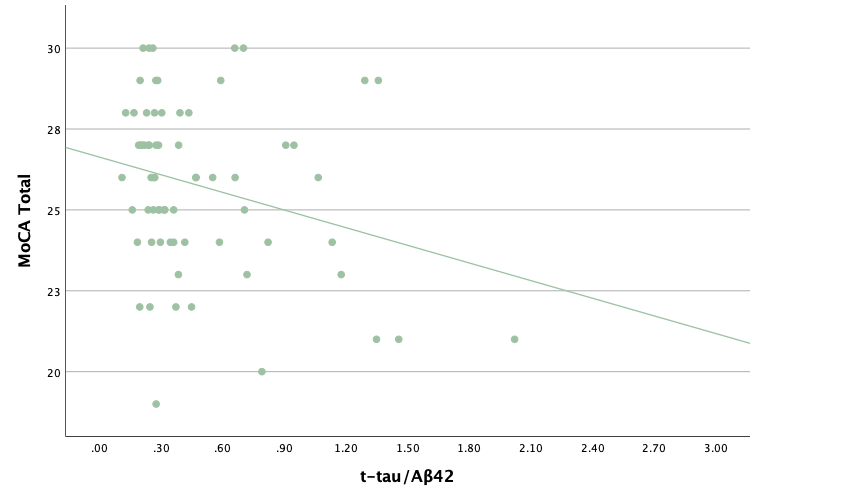
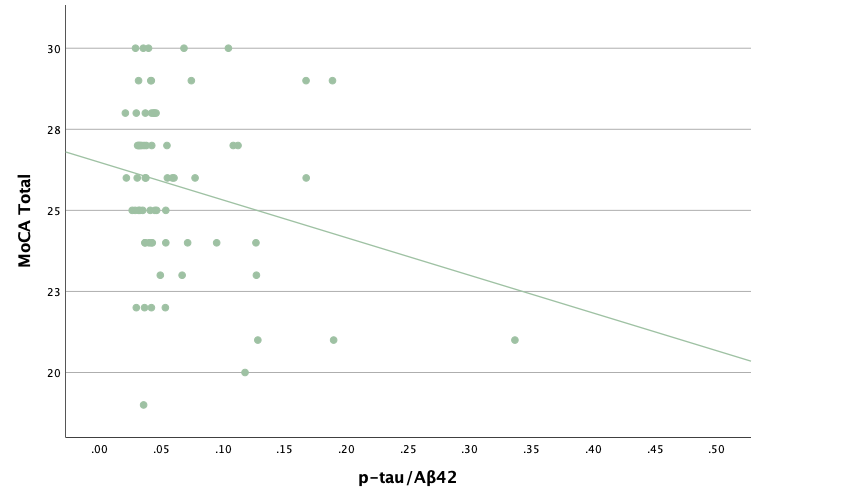
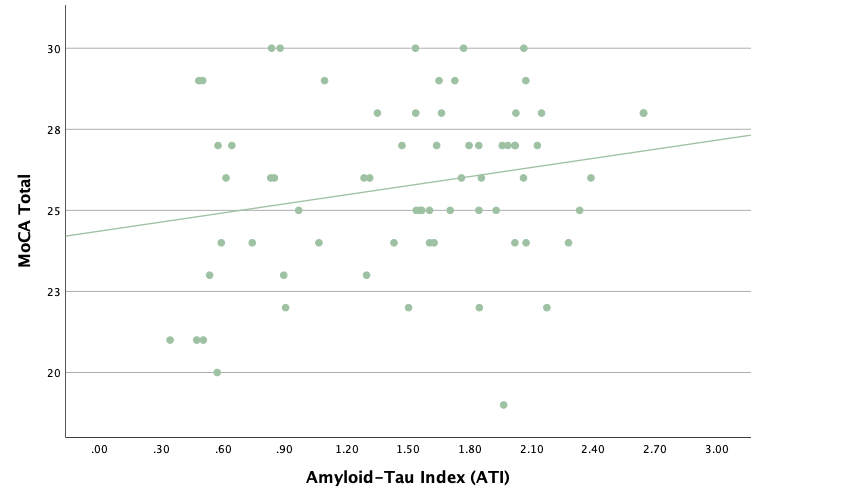
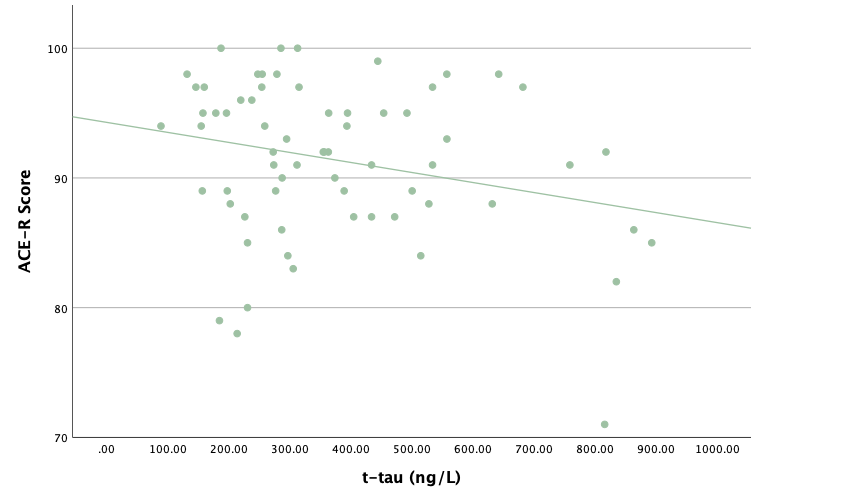
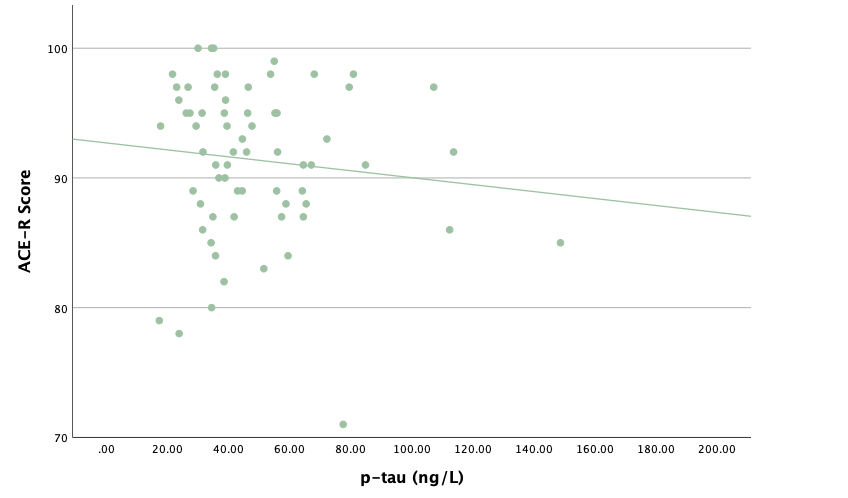
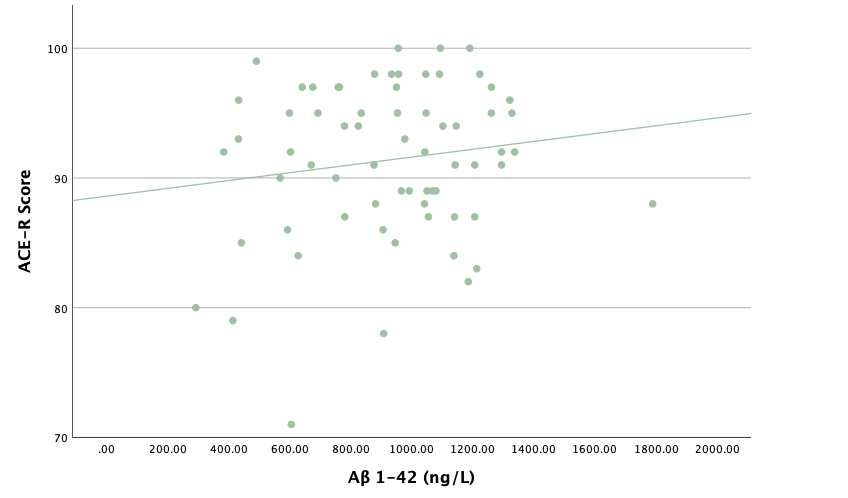
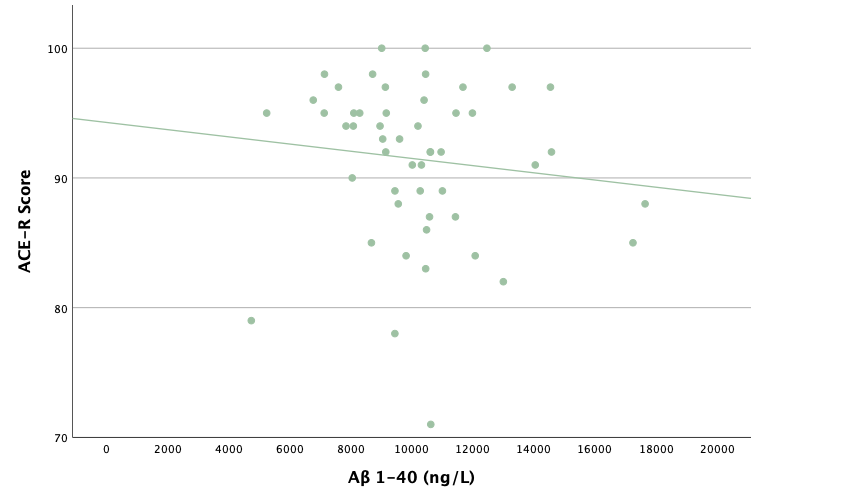
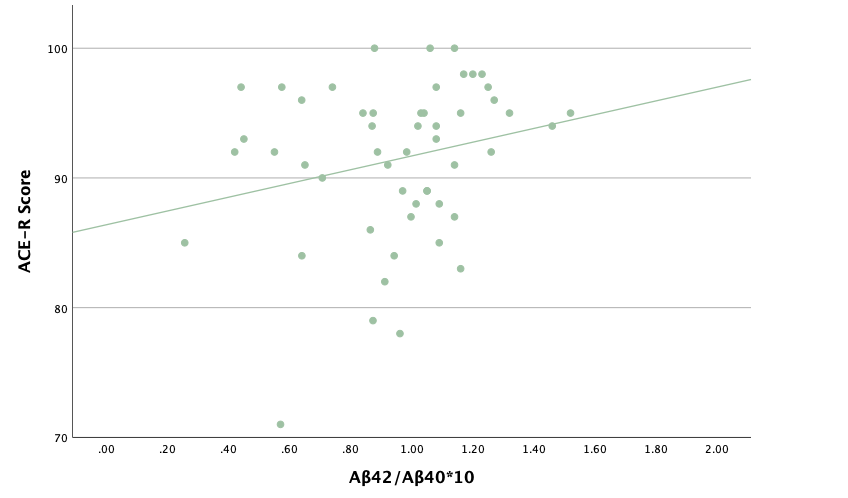
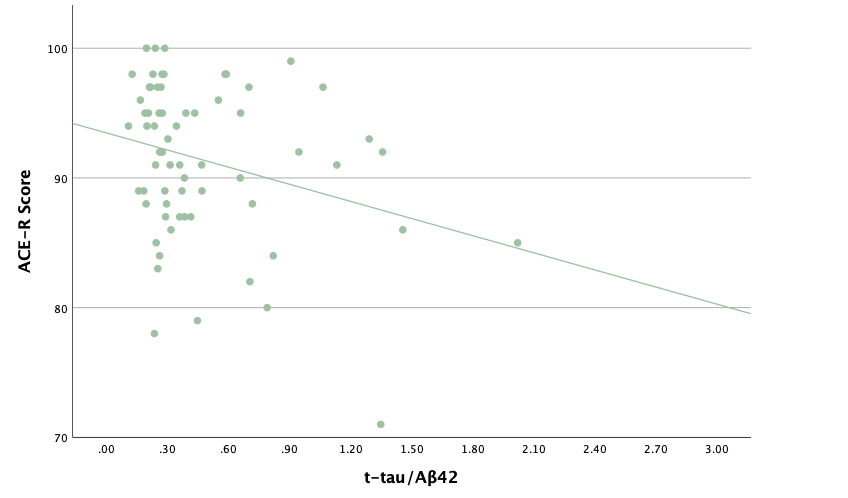
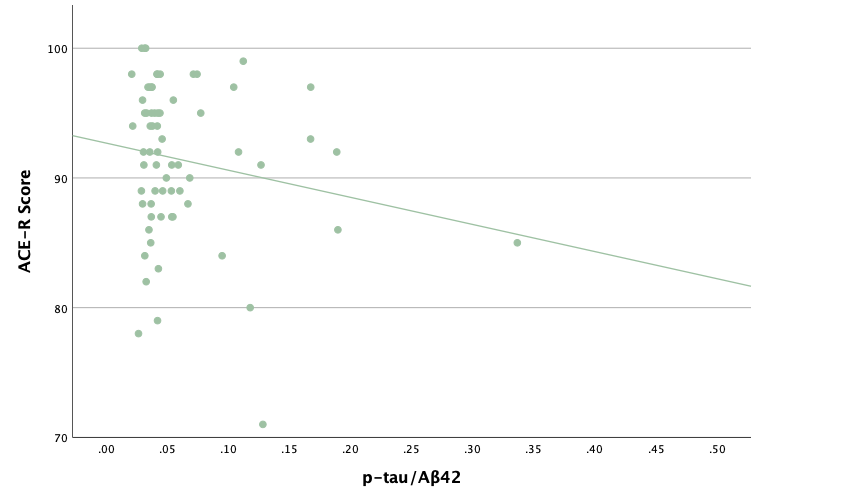
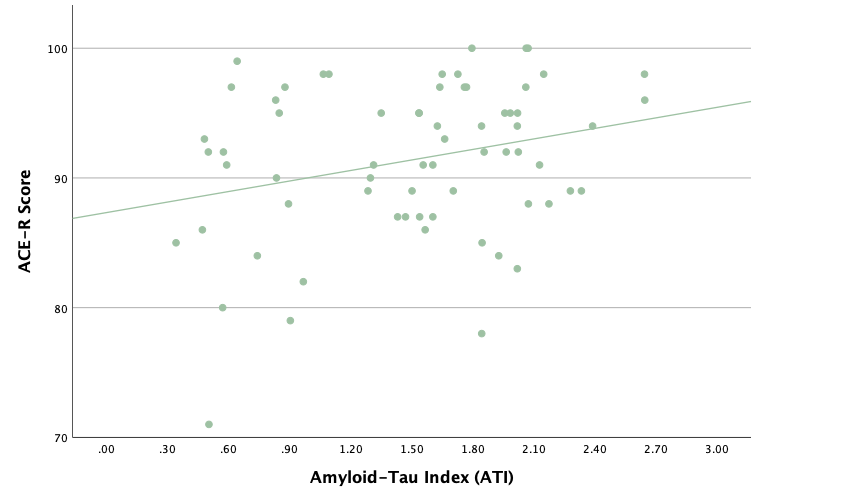
With the same methodology as the previous set of linear regressions, a second set was conducted, using the eight protein concentrations and ratios as predictors of the cognitive assessment scores, recognizing age and group status as other potential predictors. Looking at the significance values using each protein concentration and ratio as predictors for MoCA and ACE-R scores, all the P-values exceed the 0.05 threshold and result in statistically insignificant regressions. The lack of strength and value of these regressions is corroborated with the graphical representations of the regression analysis, in which even the strongest associations, such as that between Aβ40 and MoCA scores, don't exhibit strong trends.
Conclusion
Overall, the statistical analyses determined that there is some significance with regard to CSF protein concentrations in first-time TIA patients at risk of more severe cognitive decline. The descriptive/frequency analyses revealed that not only do trends exist when comparing TIA individuals with healthy controls, but these trends are also consistent with what existing research has suggested appears when comparing truly demented individuals with healthy controls, suggesting some correlation between CSF protein concentrations in early stages and late stages of cognitive decline. Specifically, there were higher t-tau and p-tau concentrations in TIA individuals compared with controls, which tends to suggest in clinical practice that neurofibrillary tangles have formed and facilitated dementia. Lower Aβ42 concentrations suggest the aggregation of Aβ peptides as senile plaques in brain tissues. The ratios, based on the individual proteins which exhibited trends similar to dementia patients, were also consistent with existing research with regard to late-life cognitive decline. Lastly, cognitive assessment scores were lower in TIA patients compared to controls, suggesting a relatively immediate impact on cognitive function with the occurrence of TIA and the changes in CSF protein concentrations.
The independent samples t tests conducted following the descriptive analyses largely corroborated the evidence that there are similarities between early and late stages of cognitive decline with regard to CSF protein concentrations and ratios. Statistical significance, by way of P-values lower than 0.05, was established for t-tau, p-tau, Aβ42, t-tau/Aβ42, p-tau/Aβ42, and ATI, with the Aβ40 and Aβ42/Aβ42*10 metrics not being statistically significant. Ultimately, this concludes that the differences in the tau protein concentrations and their corresponding ratios, along with Aβ42 are unlikely to be due to chance and that they most likely play some role in early forms of cognitive decline. With Aβ peptide metrics not being statistically significant, it tends to suggest that the role of these peptides in facilitating more severe cognitive decline occurs more significantly in later stages of cognitive decline, whereas tau proteins start to exhibit dementia trends after the occurrence of a minor stroke, preceding significant cognitive changes.
Lastly, although statistical significance was established for many metrics, the linear regressions that on the whole, each metric is not a particularly strong predictor of another metric. Statistically significant regressions were determined for p-tau, ATI, and MoCA and ACE-R scores when group status was the predictor, with t-tau, t-tau/Aβ42, and p-tau/Aβ42 as marginally significant, but despite this, the strength of these correlations is weak, with age often being a stronger predictor. In using the protein concentrations and ratios as predictors of the cognitive assessment scores, no regressions were deemed statistically significant, which was corroborated by graphical evidence in which the strength of the least-squares regression lines were weak.
Because of statistically significant metrics determined by the t tests, I can conclude that there are differences with regard to CSF protein biomarkers that is related to the development of cognitive decline, and because of this, further exploration into CSF proteins in TIA patients is valuable. Although the metrics are not good predictors of each other, the coincidence of one trend can suggest higher or lower levels of cognitive decline in TIA patients, which provides a basis for clinicians to have a more holistic understanding of TIA occurrences and means of efficiently and efficaciously addressing developing cognitive decline.
It is important to note that there are some limitations to the data that potentially influenced the validity of the results, rooted in the methodology of the PREVENT Study. Specifically, the most significant limitation is the fact that a relatively small sample size was used for conducting this analysis (34 TIA, 36 control), increasing the likelihood of Type II statistical errors when running the significance tests and linear regressions. The small sample size decreased the power of the tests that were conducted, resulting in it being harder for the tests do determine if the differences in the protein concentrations, ratios, and cognitive test scores were due to chance or were more likely to be some other factor. This is particularly evident when looking at the P-values for some of the linear regressions using group status as a predictor. Metrics like t-tau, t-tau/Aβ42, and p-tau/Aβ42 had significance values of slightly larger than 0.05, likely a result of the tests not having a large enough sample size to establish if those differences were statistically significant. To help accomodate for that, I included values up to 0.06 as marginally significant, recognizing that those regressions could be significant predictors, but these tests could not officially conclude that. Although, regardless, none of the regressions were particularly strong, so that lack of power didn't influence the conclusions drastically. The second significant limitation was the times the lumbar punctures were taken; in some cases, CSF was collected a week after the TIA occurrence whereas it was after five years for some individuals. The lack of pairing for the t tests, given I was looking for holistic trends, resulting in a larger distribution (variability) of data that could have also led to statistically insignificant metrics (eg. Aβ42/Aβ40*10).
But apart from reconducting this portion of the study by increasing sample size and enforcing consistent lumbar puncture times, there is one other project improvement that I hope to conduct later this year. The neuropsychological battery conducted within the PREVENT study in which MoCA and ACE-R scores were assessed consisted of over ten different assessments that not only looked holistically at the impact of cognitive decline on function, but also at very specific domains such as memory retention, focus, linguistic function, etc.. Conducting analysis of those other tests in conjunction with the CSF protein concentrations could provide more specific conclusions about the relationship between differing protein concentrations and cognitive function. The fact that the two cognitive tests assessed within this scope of the study assessed holistic impacts on cognitive function resulted in the protein concentrations not being good predictors of those test scores, but perhaps significant trends could be established when looking at tests focused on specific cognitive domains.
Citations
References
1. Chang F, Patel T, Schulz ME. The “Rising Tide” of dementia in Canada: What does it mean for pharmacists and the people they care for?: What does it mean for pharmacists and the people they care for? Can Pharm J (Ott). 2015;148(4):193-199. doi:10.1177/1715163515588107
2. Navigating the Path Forward for Dementia in Canada. https://alzheimer.ca/sites/default/files/documents/Landmark-Study-Report-1-Path_Alzheimer-Society-Canada_0.pdf
3. Livingston G, Sommerlad A, Orgeta V, et al. Dementia prevention, intervention, and care. Lancet. 2017;390(10113):2673-2734. doi:10.1016/S0140-6736(17)31363-6
4. Tariq S, d’Esterre CD, Sajobi TT, et al. A longitudinal magnetic resonance imaging study of neurodegenerative and small vessel disease, and clinical cognitive trajectories in non demented patients with transient ischemic attack: the PREVENT study. BMC Geriatr. 2018;18(1):163. doi:10.1186/s12877-018-0858-4
5. Tariq S, Tsang A, Wang M, et al. White matter tract microstructure and cognitive performance after transient ischemic attack. PLoS One. 2020;15(10):e0239116. doi:10.1371/journal.pone.0239116
6. Coutts SB. Diagnosis and management of transient ischemic attack. Continuum (Minneap Minn). 2017;23(1, Cerebrovascular Disease):82-92. doi:10.1212/CON.0000000000000424
7. Trunz LM, Gandhi AV, Karambelkar AD, Lange SM, Rao VM, Flanders AE. National trends in lumbar puncture from 2010 to 2018: A shift reversal from the emergency department to the hospital setting for radiologists and advanced practice providers. AJNR Am J Neuroradiol. 2021;42(1):206-210. doi:10.3174/ajnr.A6870
8. Avila J, Lucas JJ, Perez M, Hernandez F. Role of tau protein in both physiological and pathological conditions. Physiol Rev. 2004;84(2):361-384. doi:10.1152/physrev.00024.2003
9. Iqbal K, Liu F, Gong CX, Grundke-Iqbal I. Tau in Alzheimer disease and related tauopathies. Curr Alzheimer Res. 2010;7(8):656-664. doi:10.2174/156720510793611592
10. Sperling RA, Mormino EC, Schultz AP, et al. The impact of amyloid-beta and tau on prospective cognitive decline in older individuals. Ann Neurol. 2019;85(2):181-193. doi:10.1002/ana.25395
11. Hampel H, Blennow K, Shaw LM, Hoessler YC, Zetterberg H, Trojanowski JQ. Total and phosphorylated tau protein as biological markers of Alzheimer’s disease. Exp Gerontol. 2010;45(1):30-40. doi:10.1016/j.exger.2009.10.010
12. Chen GF, Xu TH, Yan Y, et al. Amyloid beta: structure, biology and structure-based therapeutic development. Acta Pharmacol Sin. 2017;38(9):1205-1235. doi:10.1038/aps.2017.28
13. Kim J, Onstead L, Randle S, et al. Aβ40 inhibits amyloid depositionin vivo. J Neurosci. 2007;27(3):627-633. doi:10.1523/jneurosci.4849-06.2007
14. Zaretsky DV, Zaretskaia MV, Molkov YI, Alzheimer’s Disease Neuroimaging Initiative. Patients with Alzheimer’s disease have an increased removal rate of soluble beta-amyloid-42. PLoS One. 2022;17(10):e0276933. doi:10.1371/journal.pone.0276933
15. Graff-Radford NR, Crook JE, Lucas J, et al. Association of low plasma Abeta42/Abeta40 ratios with increased imminent risk for mild cognitive impairment and Alzheimer disease. Arch Neurol. 2007;64(3):354-362. doi:10.1001/archneur.64.3.354
16. Doecke JD, Pérez-Grijalba V, Fandos N, et al. Total Aβ42/Aβ40 ratio in plasma predicts amyloid-PET status, independent of clinical AD diagnosis. Neurology. 2020;94(15):e1580-e1591. doi:10.1212/WNL.0000000000009240
17. PREVENT study protocol-REB13-0240_April_30_2024_V9_CLN.
18. Huang Y, Li Y, Pan H, Han L. Global, regional, and national burden of neurological disorders in 204 countries and territories worldwide. J Glob Health. 2023;13:04160. doi:10.7189/jogh.13.04160
19. Aranda MP, Kremer IN, Hinton L, et al. Impact of dementia: Health disparities, population trends, care interventions, and economic costs. J Am Geriatr Soc. 2021;69(7):1774-1783. doi:10.1111/jgs.17345
20. Scheltens P, De Strooper B, Kivipelto M, et al. Alzheimer’s disease. Lancet. 2021;397(10284):1577-1590. doi:10.1016/s0140-6736(20)32205-4
21. Ryan NS, Biessels GJ, Kim L, et al. Genetic determinants of white matter hyperintensities and amyloid angiopathy in familial Alzheimer’s disease. Neurobiol Aging. 2015;36(12):3140-3151. doi:10.1016/j.neurobiolaging.2015.08.026
22. Chang Wong E, Chang Chui H. Vascular cognitive impairment and dementia. Continuum (Minneap Minn). 2022;28(3):750-780. doi:10.1212/CON.0000000000001124
23. Nation DA, Sweeney MD, Montagne A, et al. Blood-brain barrier breakdown is an early biomarker of human cognitive dysfunction. Nat Med. 2019;25(2):270-276. doi:10.1038/s41591-018-0297-y
24. Chojdak-Łukasiewicz J, Dziadkowiak E, Zimny A, Paradowski B. Cerebral small vessel disease: A review. Adv Clin Exp Med. 2021;30(3):349-356. doi:10.17219/acem/131216
25. Custodio N, Montesinos R, Lira D, Herrera-Pérez E, Bardales Y, Valeriano-Lorenzo L. Mixed dementia: A review of the evidence. Dement Neuropsychol. 2017;11(4):364-370. doi:10.1590/1980-57642016dn11-040005
26. Zekry D, Hauw JJ, Gold G. Mixed dementia: epidemiology, diagnosis, and treatment. J Am Geriatr Soc. 2002;50(8):1431-1438. doi:10.1046/j.1532-5415.2002.50367.x
27. Simmatis LER, Scott SH, Jin AY. The impact of transient ischemic attack (TIA) on brain and behavior. Front Behav Neurosci. 2019;13:44. doi:10.3389/fnbeh.2019.00044
28. Lee SH, Aw KL, McVerry F, McCarron MO. Systematic review and meta-analysis of diagnostic agreement in suspected TIA. Neurol Clin Pract. 2021;11(1):57-63. doi:10.1212/CPJ.0000000000000830
29. Pendlebury ST, Rothwell PM, Oxford Vascular Study. Incidence and prevalence of dementia associated with transient ischaemic attack and stroke: analysis of the population-based Oxford Vascular Study. Lancet Neurol. 2019;18(3):248-258. doi:10.1016/S1474-4422(18)30442-3
30. Cuttler JM, Moore ER, Hosfeld VD, Nadolski DL. Treatment of Alzheimer disease with CT scans: A case report. Dose Response. 2016;14(2):1559325816640073. doi:10.1177/1559325816640073
31. Warren SL, Moustafa AA. Functional magnetic resonance imaging, deep learning, and Alzheimer’s disease: A systematic review. J Neuroimaging. 2023;33(1):5-18. doi:10.1111/jon.13063
32. Pemberton HG, Collij LE, Heeman F, et al. Quantification of amyloid PET for future clinical use: a state-of-the-art review. Eur J Nucl Med Mol Imaging. 2022;49(10):3508-3528. doi:10.1007/s00259-022-05784-y
33. Hrishi AP, Sethuraman M. Cerebrospinal fluid (CSF) Analysis and Interpretation in Neurocritical Care for Acute Neurological Conditions. Indian J Crit Care Med. 2019;23(Suppl 2):S115-S119. doi:10.5005/jp-journals-10071-23187
34. Doherty CM, Forbes RB. Diagnostic Lumbar Puncture. Ulster Med J. 2014;83(2):93-102. Accessed January 27, 2025. https://pmc.ncbi.nlm.nih.gov/articles/PMC4113153/
35. Gu L, Guo Z. Alzheimer’s Aβ42 and Aβ40 peptides form interlaced amyloid fibrils. J Neurochem. 2013;126(3):305-311. doi:10.1111/jnc.12202
36. Campbell MR, Ashrafzadeh-Kian S, Petersen RC, et al. P-tau/Aβ42 and Aβ42/40 ratios in CSF are equally predictive of amyloid PET status. Alzheimers Dement (Amst). 2021;13(1):e12190. doi:10.1002/dad2.12190
37. Mirza SS, Saeed U, Knight J, et al. APOE ɛ4, white matter hyperintensities, and cognition in Alzheimer and Lewy body dementia. Neurology. 2019;93(19):e1807-e1819. doi:10.1212/WNL.0000000000008377
38. Mahley RW. Apolipoprotein E: from cardiovascular disease to neurodegenerative disorders. J Mol Med. 2016;94(7):739-746. doi:10.1007/s00109-016-1427-y
39. Serrano-Pozo A, Das S, Hyman BT. APOE and Alzheimer’s disease: advances in genetics, pathophysiology, and therapeutic approaches. Lancet Neurol. 2021;20(1):68-80. doi:10.1016/S1474-4422(20)30412-9
40. Rasmussen KL, Luo J, Nordestgaard BG, Tybjærg-Hansen A, Frikke-Schmidt R. APOE and vascular disease: Sequencing and genotyping in general population cohorts. Atherosclerosis. 2023;385(117218):117218. doi:10.1016/j.atherosclerosis.2023.117218
Acknowledgement
I would like to thank The University of Calgary, Department of Clinical Neuroscience, Dr. Philip A. Barber, the principal investigator of the University of Calgary Stroke Team: Predementia Neuroimaging of Transient Ischemic Attack (TIA) - the PREVENT Study, Ms. Bhavana Gill and Ms. Britney Denroche, Dr. Beatriz Garcia-Diaz from Webber Academy, and the participants and research staff of the PREVENT Study that allowed for the acquisition of the data that allowed me to produce this project.