Optimizing Crop Growth With Agrivoltaics
Grade 8
Presentation
Hypothesis
Problem
Agricultural crops are a valuable resource for Alberta, but our efforts to collect renewable energy have caused problems for agriculture. Many big solar projects have been put on hold due to the lack of space to accommodate both. Because of this, farmers are encouraged to use fossil fuels and other non-renewable sources of energy to provide their high quantities of needed electricity (National Library of Medicine, 2010). With climate change increasing, new ways are needed to support these farmers using renewable energy sources (Hall, 2022).
To address this issue, an idea called "agrivoltaics" has been proposed. However, implementing this idea has been challenging for farmers because both the crops and solar panels require sunlight to grow and generate electricity.
For our project, we selected the mustard crop for testing. We sought to understand the conditions under which mustard will grow the tallest and generate the largest yield. This experiment addresses the following question:
What is the most efficient way to grow mustard crops in an agrivoltaics environment?
We selected mustard for its fast growing properties and tolerance to more difficult growing conditions. In addition to conducting the experiment with and without solar panels, we wanted to test if a ‘UbiGro yellow film’ designed to promote plant growth could also be used to improve yield.
Hypothesis
We predict that the plants growing in the setup with the growth film would generate the highest yield. We hypothesize that these trials will produce the best plants because the film directs ultraviolet light to the plants, giving them the required light to grow. This will also benefit energy collection allowing an increase in solar cells in the opaque sections.
Result 1 - Height of Plants
We predict that the solar panels containing only film will produce the tallest plants. The film can help filter unneeded light to needed light for the plant to use efficiently. This can help provide rapid growth because the plants are receiving enough light for photosynthesis to help the plant grow. The difference between the film and complete transparency is that the film can help allow needed light to pass through and not allow other light to pass through.
Result 2 - Mass of Plants
For this result, we predict that the solar panels that are semi-transparent with film will produce the most developed plants, which will weigh the most. Plants, partially shaded by solar panels can help increase the growth of the plant (Pearce, 2023). With these shaded opaque the plants will not have an excessive amount of sunlight on them. The sunlight that passes through, will be optimized to help the plant grow. We predict that this will help the plants grow effectively because of the balance between excessive light and not enough needed light for the plant to reliably grow. We also believe that a somewhat shaded plant will retain more water, making it heavier.
Overall Prediction
We predict that the plants will grow more efficiently with the film to provide them with the needed light to survive. We hypothesize that the opaque setup will also help the plants become more developed by limiting too much excessive light being directed at the plant.
Research
Background Research
This section describes the background information for this experiment.
What is Agrivoltaics?
Agrivoltaics is the utilization of agriculture and renewable energy, solar panels, containing photovoltaic cells. Given that there is a limited amount of prime agricultural land, agrivoltaics is necessary to ensure that farming land continues to be used for agriculture.
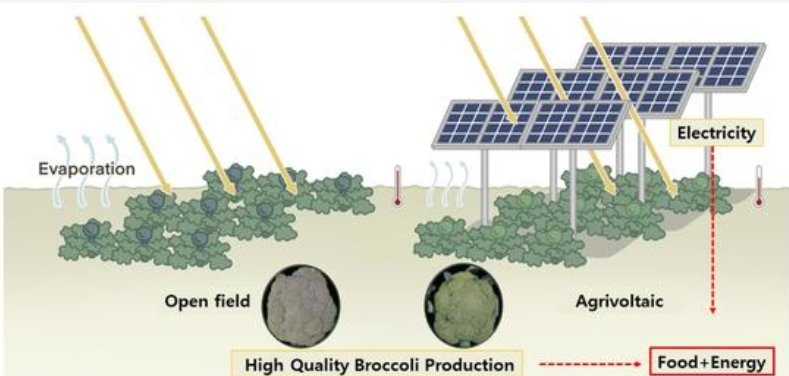
Figure 1 - Agrivoltaics Versus Traditional Open Field Farms (Chae, 2022)
The figure above is a diagram showing agrivoltaics versus a field that utilizes the traditional open field on farms. Evaporation was greater in the open field, which led to the crops drying out faster. Under the solar panels, the temperature was cooler, suggesting that a higher quality of broccoli was produced using agrivoltaics instead of the open field.
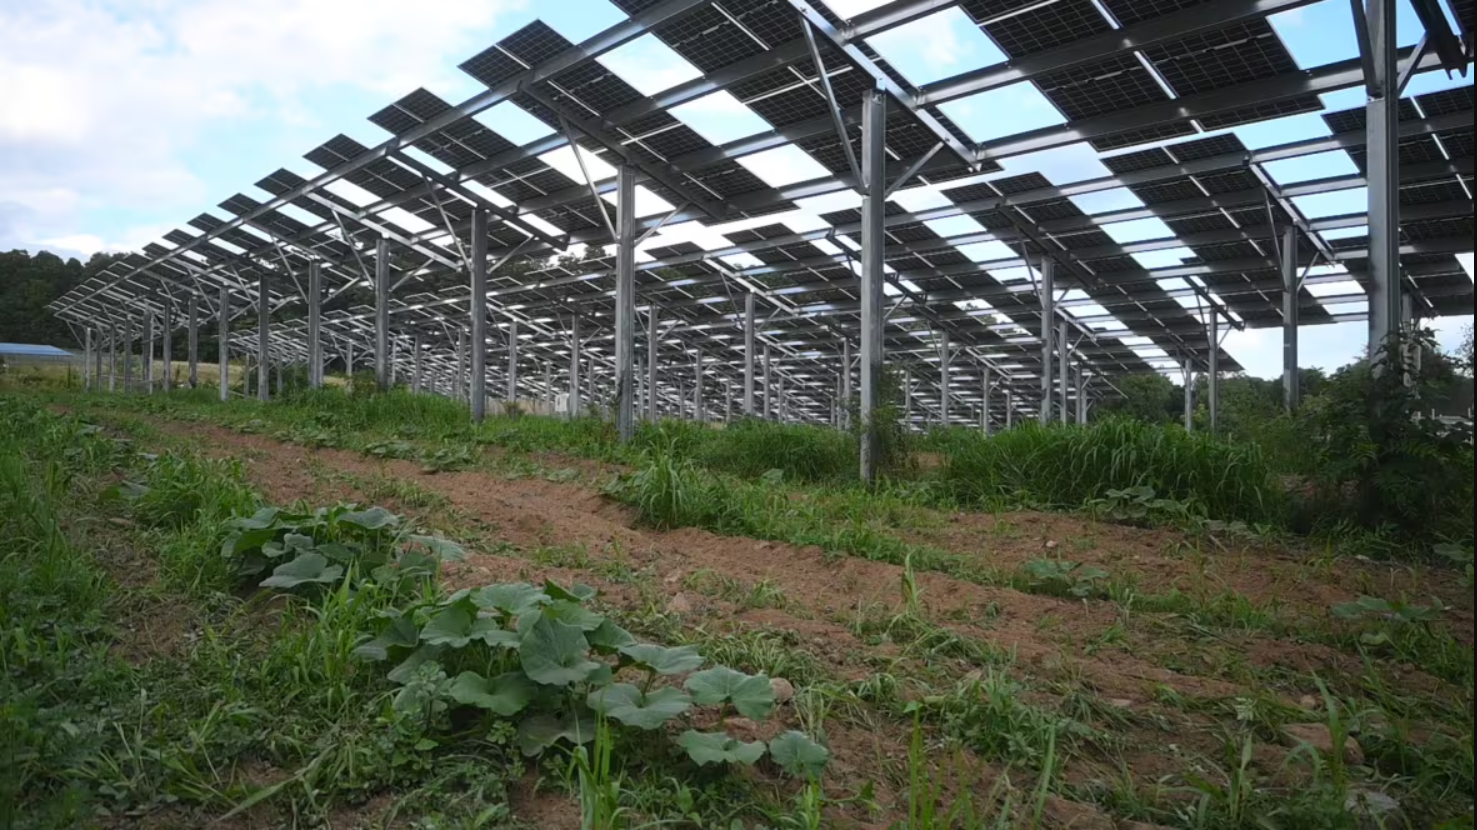
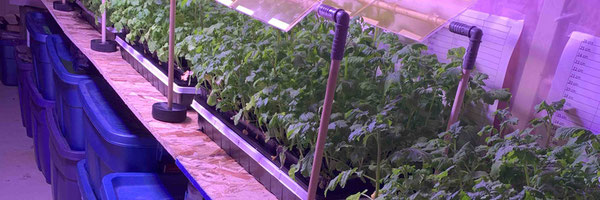
Figure 2 - Agrivoltaics Example Photo (CBC, 2023)
As shown in the figure above, agrivoltaics is an efficient use of prime agricultural land, producing both crops and electricity.
What is the Optimal Crop to be Used in Our Experiment?
Canadian provinces produce 80 percent of the world's mustard crop, making it a valuable crop to Alberta (MountainView Today, 2021). One unique trait about mustard is its fast growth rate. For this reason, mustard seed was an optimal crop to use in our experiment because the faster the crops grow the more information we could obtain on their height and mass for our analysis.
Advantages of Agrivoltaics
Agrivoltaics is a promising technology. Some of the advantages include gaining an increased yield from land as using agrivoltaics will be more productive and beneficial to society by both efficiently producing crops while collecting green energy. Additionally, agrivoltaics provide farmers with an additional source of revenue thus allowing the farmers to reinvest in their business while maximizing the diverse use of their farm land. Further, by investing in solar energy, the farmers are able to contribute to a greener future while growing food. Another environmental advantage is the reduced consumption of water because the solar panels provide partial shade (Enel, N/A).
Disadvantages of Agrivoltaics
Some disadvantages arise from the use of agrivoltaics including the extra cost of elevated solar panels. Adding elevation adds additional cost when compared to panels on a flat surface. Agrivoltaics is complex to implement, which elevates the operating costs. Finally, there is limited prime land for agriculture so it is impossible to completely avoid the loss of some agricultural land to renewable energy projects.
Previous Experiments
Various crops were grown using photovoltaic greenhouses to determine the changes to the composition of the plants' chemicals. (Federica, 2018)
The results from this study are included in the table below
Table 1 - Composition of Chemicals in Plants
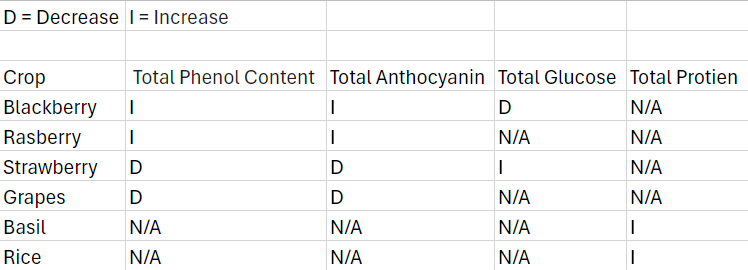
Overall, the researchers found that organic acid content was observed in all species. Fifteen percent of shade did not negatively influence the total soluble solids contained in the fruits of this plant. Even crops that normally would need a high amount of sunlight responded positively to the experiment.
A study was completed using satellite data for each province and solar simulations with bifacial photovoltaic modules (Pearce, 2023).
Researchers found that a quarter to one-third of Canada’s total electrical energy needs can be met by 1% of agricultural land using agrivoltaics. This showed that agrivoltaics could make a huge contribution to Canada’s electricity generation and lower Canada’s greenhouse gas (GHG) emissions.
The study analyzed the agrivoltaic potential of each province individually. For Alberta, the study found that if single-axis photovoltaic (PV) tracking is used, Alberta could eliminate GHG emissions from electricity production using only 1% of current agricultural land.
The following figure demonstrates the photovoltaic potential of south-facing oriented arrays in farmland regions across Alberta.
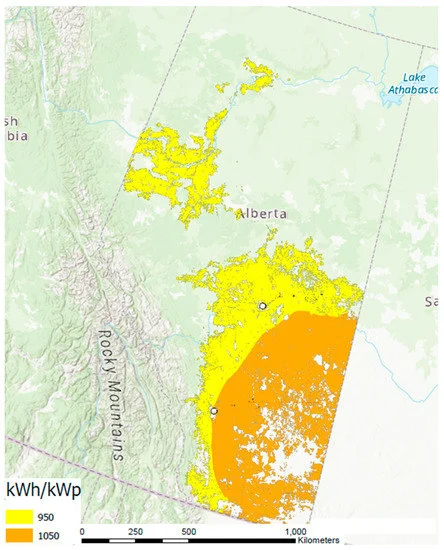
Figure 3 - Photovoltaic Potential of South-Facing Oriented Arrays Across Alberta
Although this study was semi-quantitative (includes estimation), it shows that agrivoltaic-based solar energy could far exceed the current electrical needs in Canada. Beyond generating clean energy for local consumption, the study also identified the potential to export energy and technology to other countries (Pearce, 2023)).
In another study, researchers evaluated a system of PV solar panels with crops growing under an agrivoltaics (AV) system. Researchers hypothesize that agrivoltaics will intercept significant additional solar radiation, and therefore will be highly productive, with an increase of overall land productivity as high as 60%-70% (Dupraz, 2011).
Although the panels protect from radiation, concerns have been raised about the blockage of water from the panels that come with the AV system. On the other hand, shade from the solar panels may protect crops from drying out in the sun or protect them from harmful precipitation such as hail.
A future study could experiment with different transparencies. Semi-transparent setups could yield positive results, as well as panels with a mirrored backside. The key to optimizing the productivity of an AV system is making needed adjustments to the panels to ensure that the crop yield is either increased or stays similar to an open field.
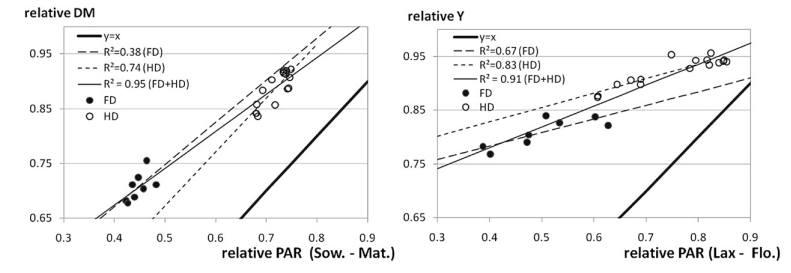
Figure 4 - Durum Wheat Grown Using an Agrivoltaics System
The figure above shows two diagrams of an experiment on durum wheat grown under full-density (FD) (opaque) panels and half-density (HD) (semi-transparent) panels. The diagram on the left shows the relative biomass or dry matter (DM) of each plant on the Y-axis and the amount of radiation let through on the X-axis. The diagram on the right shows the relative yield (Y) of grain per crop versus the amount of radiation let through.
On the dry matter (DM) diagram, the mass of each plant increased significantly under the HD panels as is the radiation. But under the FD panels, much less radiation is let through and the mass is significantly lower as compared to under the HD panels. On the Yield (Y) diagram, the seed yield is increased under the HD panels as is the radiation. Under the FD panels, less radiation is let through and the seed yield is lower as compared to the HD panels. From the diagram, this study found that HD panels increased crops' yield and mass.
Variables
Variables
This section describes the variables in this experiment.
Controlled Variables
The controlled variables are:
- Plant - mustard seeds
- Soil
- Growth conditions - lighting, atmospheric, humidity, pressure, temperature
- Amount of sunlight each day received by each plant
- Height of the lighting
- Height of the solar panels
- Number of seeds per trial
- Area for each plant to grow - the space for the seeds per each trial sector
- Type of water each plant receives (freshwater)
Manipulated Variables
For our given experiment the variable that was changed is the transparency of the solar panels over the plants.
In our experiment, we also used a yellow film for two different trials that help direct sunlight to the plants:
- Semi-transparent with the film underneath
- Film over transparent solar panels
Responding Variables
In our experiment two responding variables were recorded:
- Height of the plants
- Mass of the plants
Throughout our experiment, we recorded the height of all the plants measuring once every two days. At the end of the experiment, we recorded the mass of the plants in each trial.
Procedure
Materials
This section outlines the materials used in our experiment.
Materials for Solar Panel Setup
Home Depot materials:
- Pro-Connect Poly Insert Tee - ¾ Inch
- Pro-Connect Poly Insert Elbow - ¾ Inch
- Alexandria Moulding Hardwood Dowel ¾ In. x 48 In. Red
- Scotch Vinyl Electrical Tape 700 - black
- For tests with opaque or semi-transparent covering
- Scotch Vinyl Electrical Tape - red
- For the robot to sense in code
Canadian Tire materials:
- Hockey Puck, Black, 6-oz
UbiGro materials:
- UbiGro Greenhouse Film
- For tests with film
Supply King materials:
- 4’x8’ - ⅛” Acrylic Clear Plastic Sheets
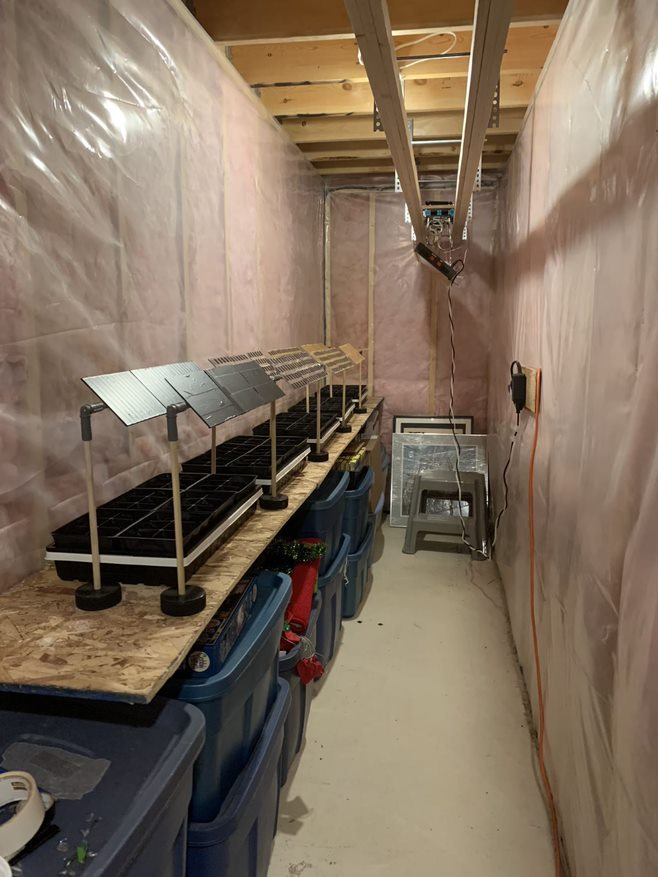
Figure 5 - Solar Panel Setup
Materials for Plant Setup
Garden Retreat materials:
- 1020 Tray No Holes
- Narrow Seed Tray Black W/ Holes
- 6x6 Insert Trays
- Promix Premium Potting Mix
The Incredible Seed CO:
- Microgreen Seeds - Mustard, Yellow
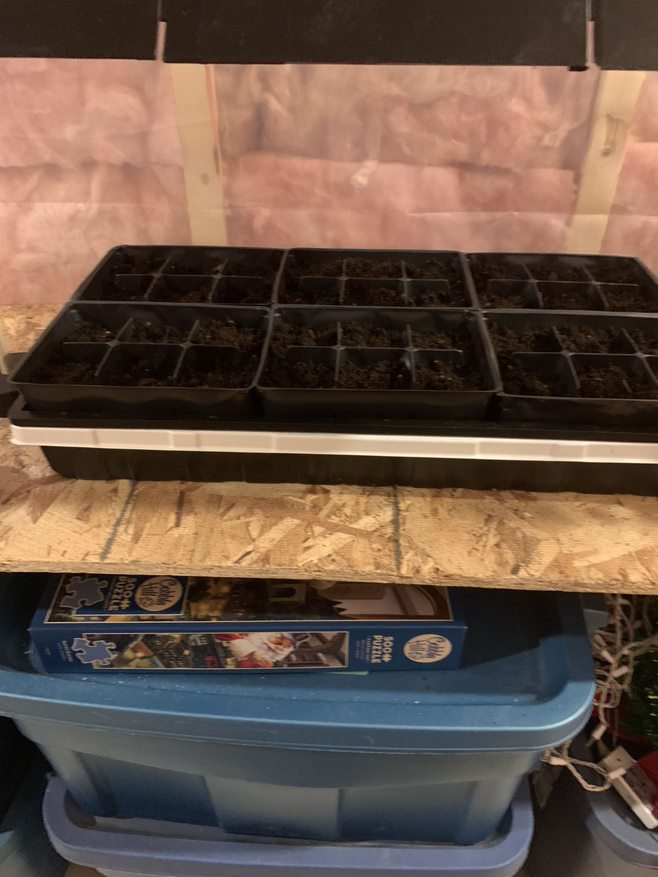
Figure 6 - Plant Setup
Materials for Robot Setup
Lego Mindstorm Materials:
- Lego Mindstorm hub
- Lego Mindstorm motors
- Lego Mindstorm Lego pieces
Home Depot materials:
- 2x4x92 ⅝ SPF Select Stud
- 12x7 Plywood
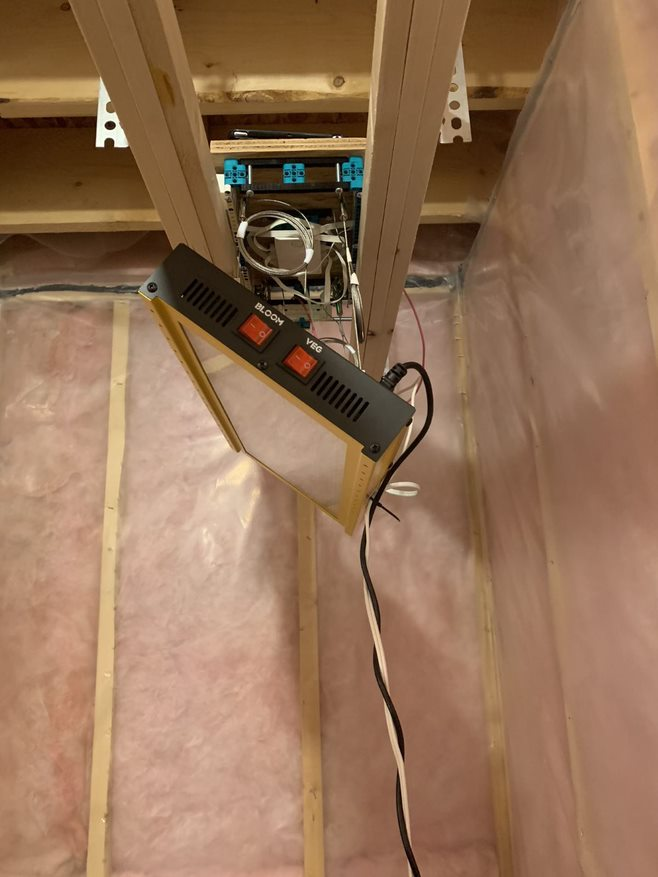
Figure 7 - Robot Setup
Procedure
This section of our report describes our experimental procedure.
Plant Setup
- Cut a hole in the 1020 Tray No Holes
- This would be for draining excess water when using the bottom watering method
- Put dirt inside the container
- Use a one half cup of dirt in each container
- Repeat step 2 for each container (180 times in total)
- Plant six yellow mustard seeds in each container
- Repeat step 4 for each container (180 times in total)
- Water the plants
- By spray bottle 3 times each twice a day until the plants have reached a sufficient height for step 6b.
- Bottom watering method for plants with 8 cups once a day
- Repeat daily watering until final harvest.
Robot Setup
- Cut the track into 3 pieces spanning the length of the room
- Two pieces are attached to a higher piece in the middle
- Repeat to create a second track
- Screw 3 pieces of plywood together and secure to ceiling
- Install a plastic border with wheel motors onto plywood to improve stability, preventing the robot from falling off the track
- Screw hub into plywood
- Connect the motors to the hub via wires
- Add red tape to indicate the starting and stopping points
- Determine the number of rotations the robot makes to traverse the track in 16 hours
- Use the code included in the report to program the robot (see code in Appendix A)
Measuring Final Weight and Height of Plants
- Break apart 6 x 6 trays using scissors
- Do not take out the plants
- Keep soil inside
- Measure the tallest plant inside the tray with a ruler or measuring tape
- Label 6 x 6 trays A-F as shown in the diagram below
- Take plants out of the soil
- Wash the plants in water
- Use a paper towel to soak excess water from the plant
- Weigh the plant using on an electronic scale and record the results
- Repeat this step 2 additional times (3 in total) for averaging purposes
- Count the number of plants that grew in the given container

Figure 8 - Layout of Crops per Trial
Observations
Observations
This section describes the observations in this experiment. Note that the following titles for each case will be abbreviated. C (control), OP (opaque), ST (semi-transparent), STF (semi-transparent with film), F (film).
Debugging the Code
During the testing of the robot, several issues were discovered inside the code
- The robot would not reset to the beginning of the track
- When the robot sensed the red tape only 1 motor would move
- To solve this the motors were merged into one code ensuring that the program ran at the same time when sensing the tape
- When the robot sensed the red tape only 1 motor would move
- The robot continued moving back at the beginning of the track
- Similar to the issue above, once the sensor identified the wall, only one motor would stop
- The solution for this issue was the same as the one above - merging the motors into one code to ensure that they would stop at the same time
- Similar to the issue above, once the sensor identified the wall, only one motor would stop
- The distance sensor did not work
- With the motors constantly moving towards the red tape the distance sensor could not react in time to the constant movements
- To solve this problem we slowed the robot down when moving at a faster pace toward the wall and increased the reflex timing of the sensor allowing it to change direction
- With the motors constantly moving towards the red tape the distance sensor could not react in time to the constant movements
- All motors would not run at the same time
- Since each motor ran separately, the chance of the motors running at different times significantly increased
- To solve this a timer was used to track when each motor would start allowing them to run in synchronization
- Since each motor ran separately, the chance of the motors running at different times significantly increased
Plant Growth
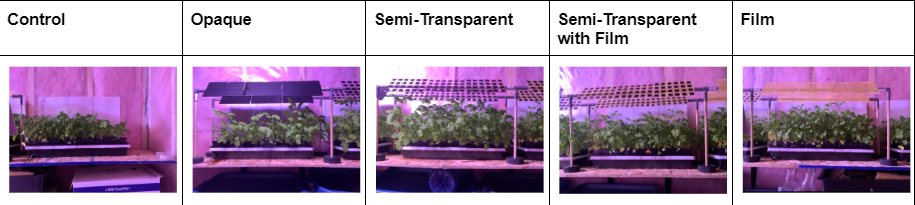
After 7 weeks, this image shows the growth of the plants.
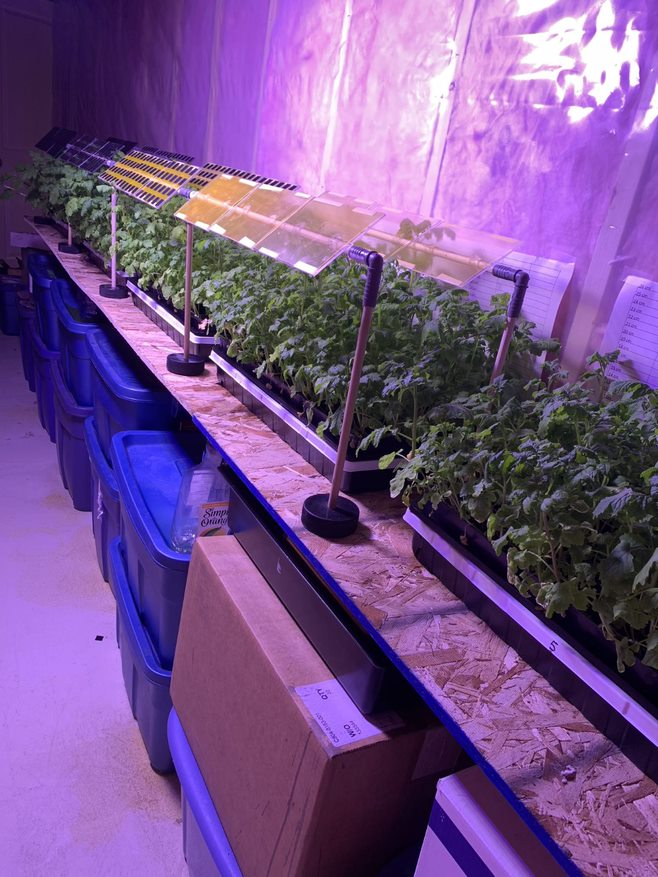
Figure 9 - Plant Growth After 7 Weeks
Table 2 - Plant Growth for Each Test
Plant Count In Each Container
This section describes the plant count for each given case. Each container in the 6 x 6 tray was given 6 seeds. Not all of the seeds in each container grew. The table below describes each container and the number of seeds that grew and were part of the mass (and height) recordings in the experiment.
Table 3 - Plant Count for Each Container
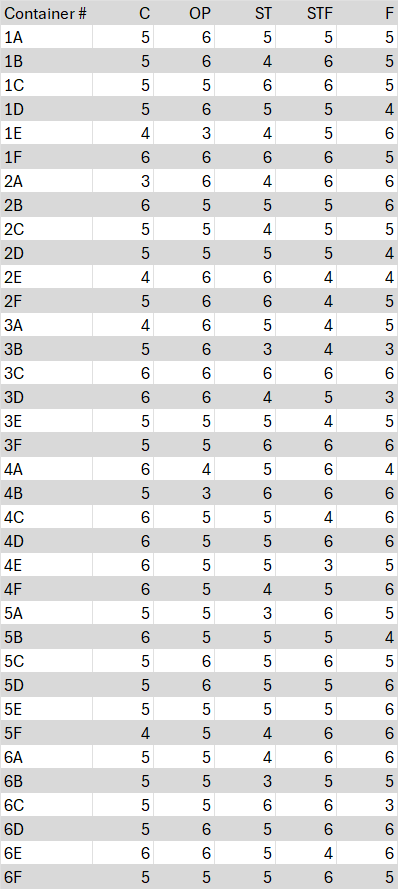
This table describes the amount of plants grown in each container. Overall about 5 plants were successfully grown with little variation between the different trials. This helps prove that the solar panels did not have an impact on whether a seed would grow or not.
Plant Harvesting
The following image shows us harvesting the mustard plants.
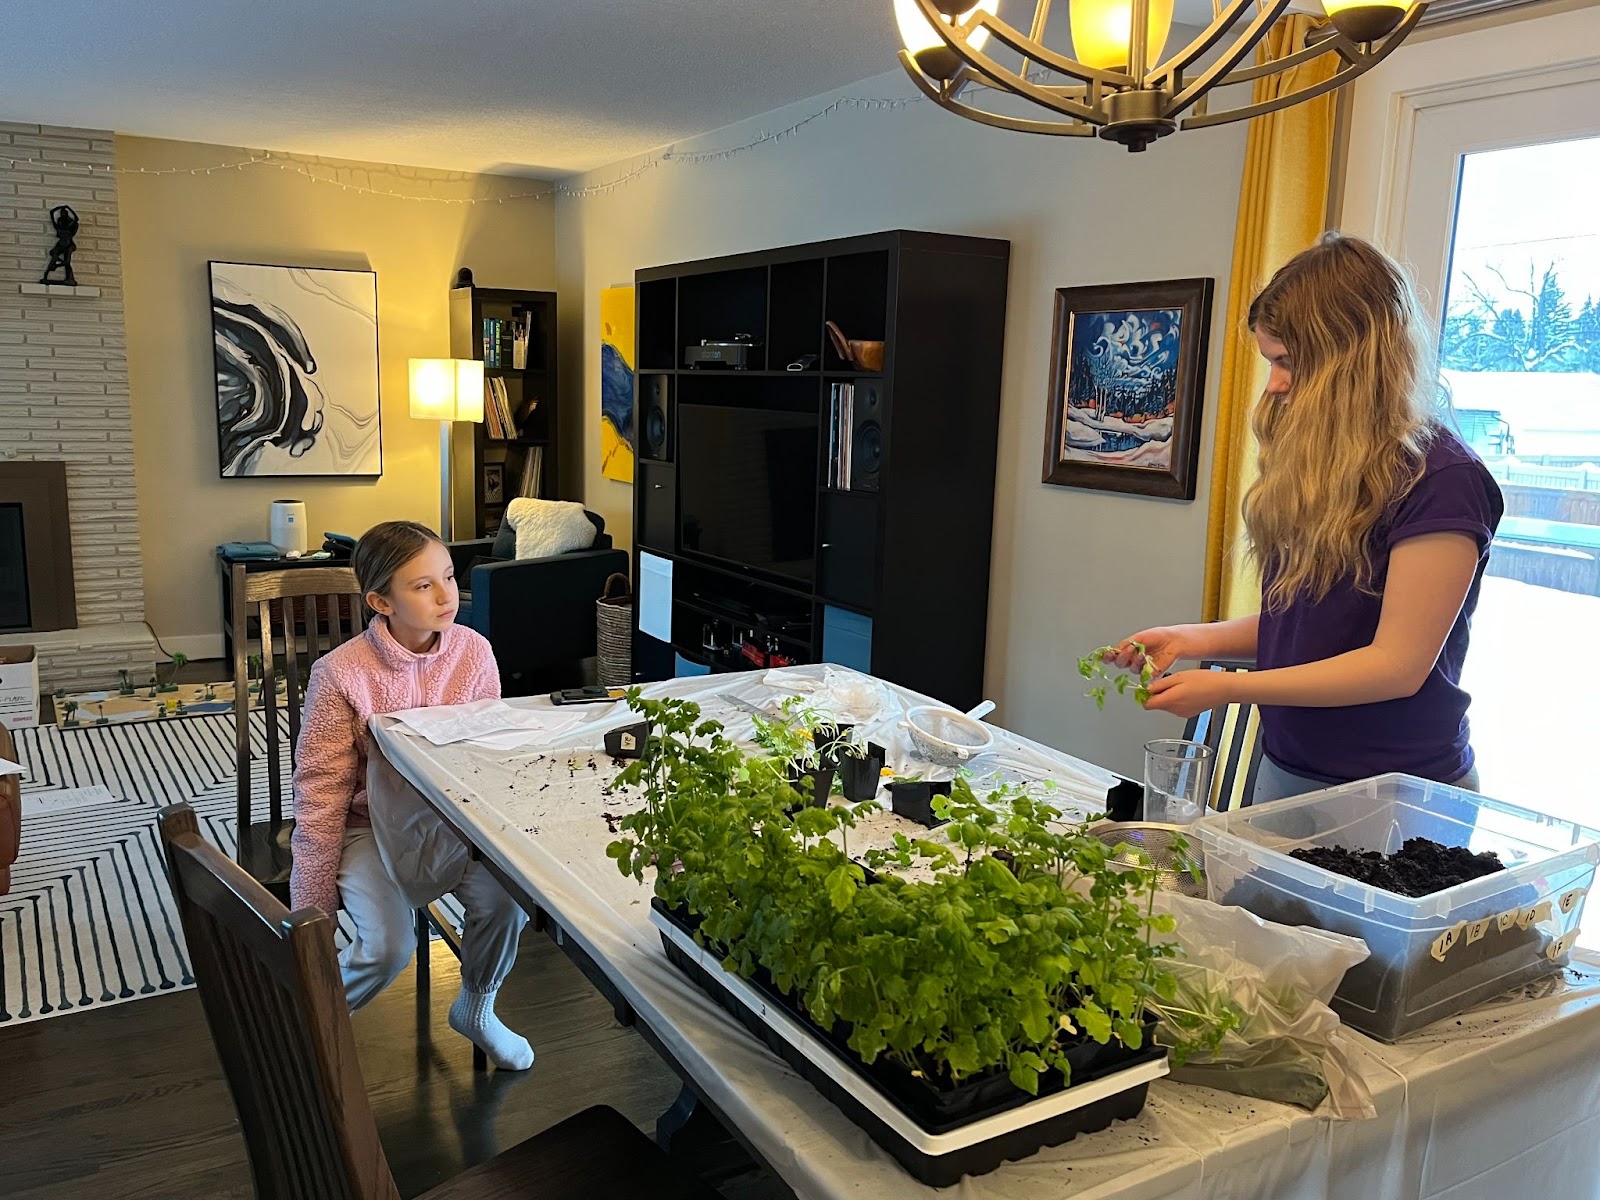
Figure 10 - Ariel and Ella Harvesting the Mustard Plants
Plant Height
This section shows the height of the tallest plant for each case. The tallest plant was always measured in each container.
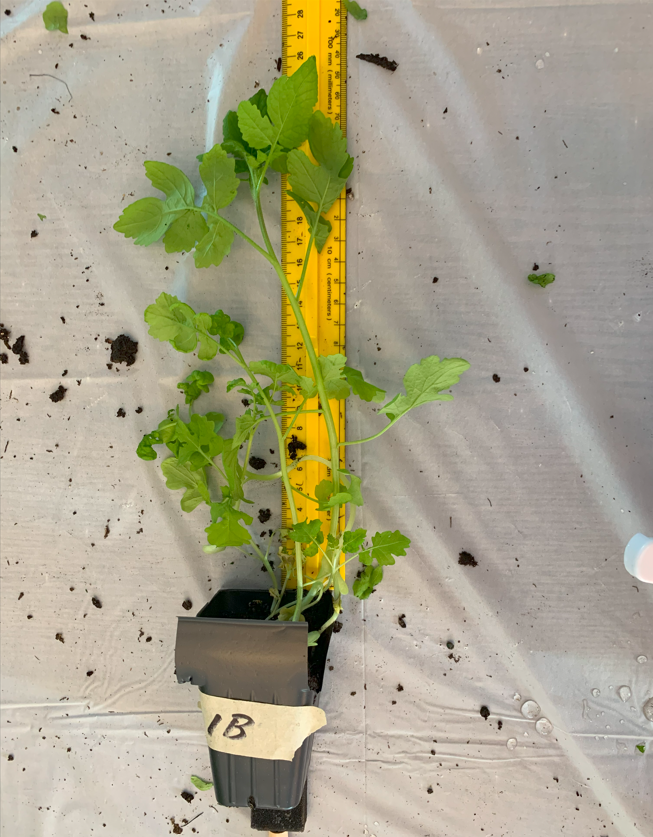
Figure 11 - Measuring Height During Harvesting
Table 4 - Height of the Tallest Plant per Container
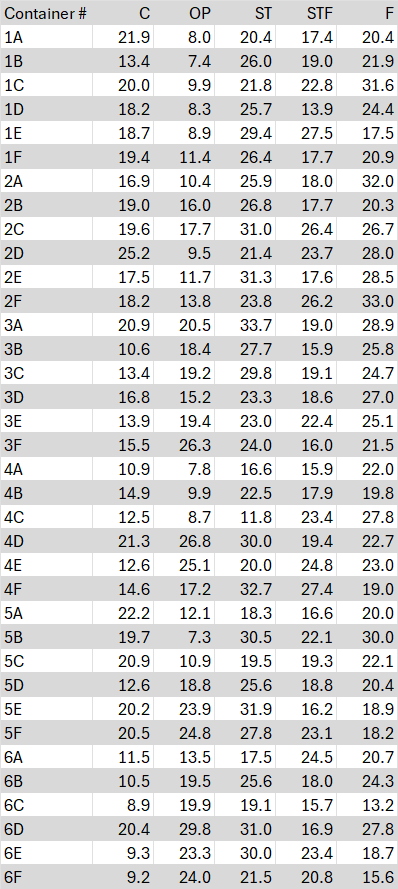
This table shows the tallest plant in each container. The tallest plant was measured to show the potential growth using agrivoltaics. This data shows the most potential growth in the semi-transparent solar panels.
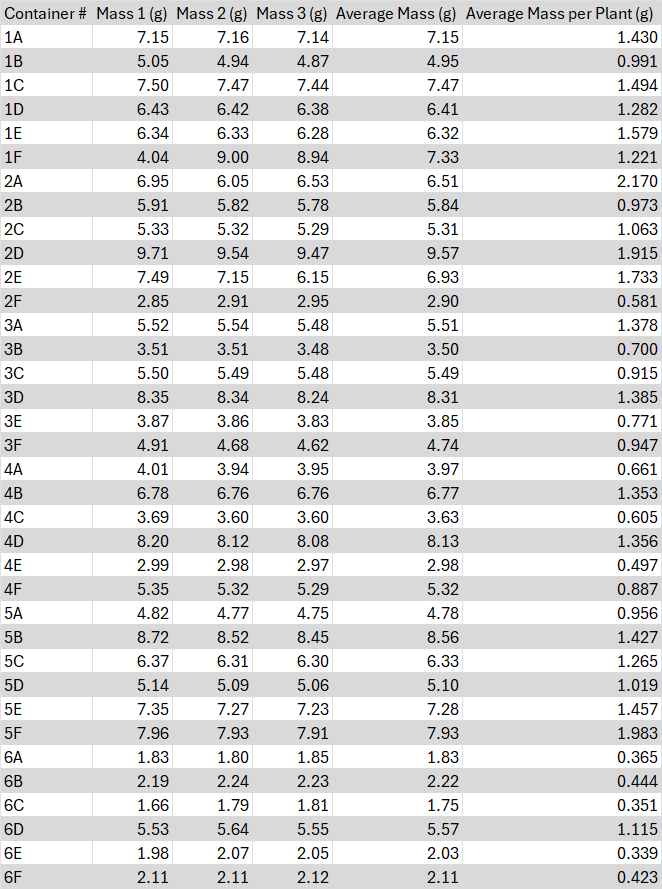
Plant Yield
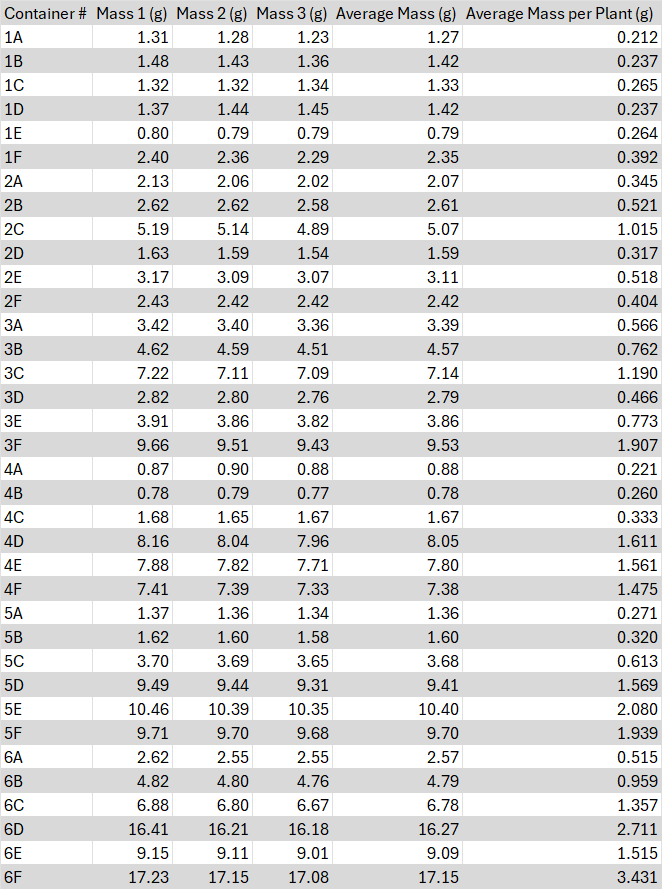
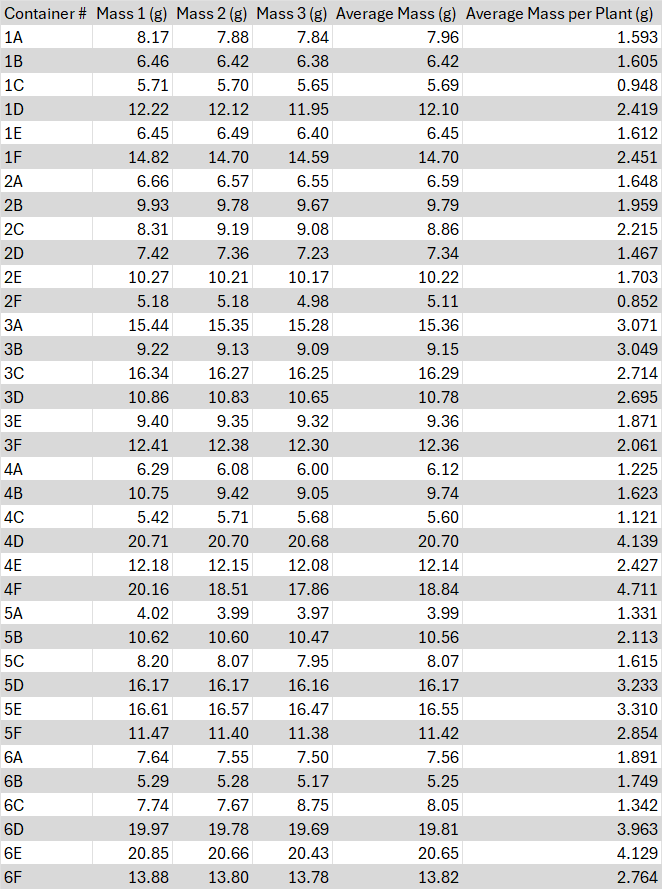
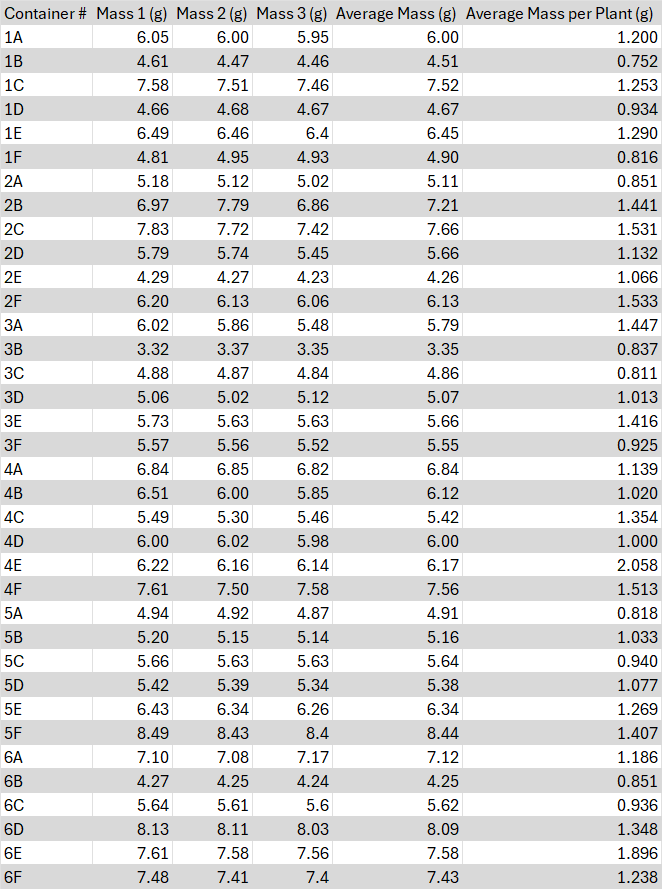
This section describes the plant yield (mass) for each container. After harvesting, the plants were weighed three times. The average mass of the three trials and the mass per plant is included in the table. The average mass per plant was based on the plant count.
Control
Table 5 - Yield for Control Case
Opaque
Table 6 - Yield for Opaque Case
Semi-Transparent
Table 7 - Yield for Semi-Transparent Case
Semi-Transparent with Film
Table 8 - Yield for Semi-Transparent with Film Case
Film
Table 9 - Yield for Film Case
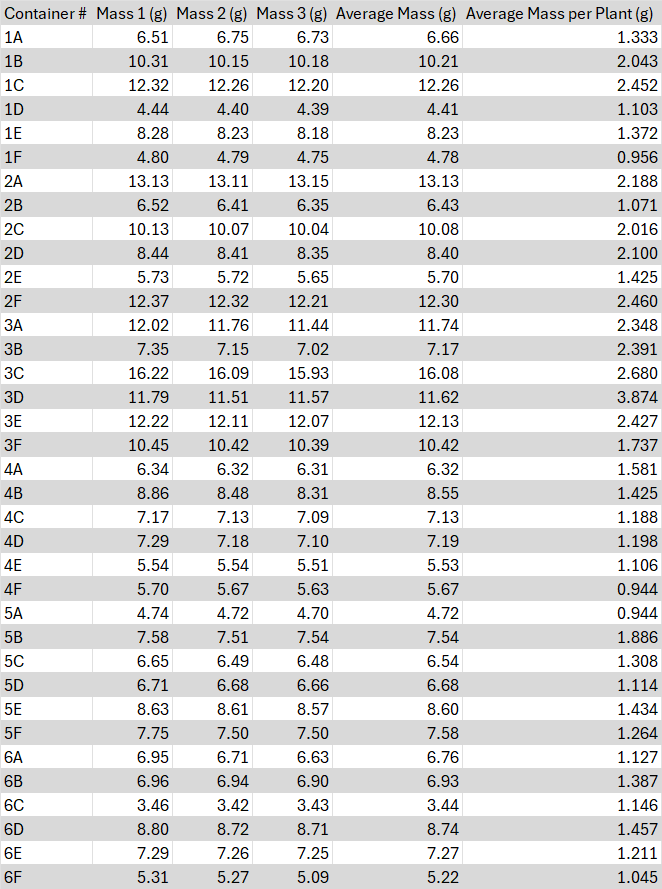
These tables show that semi-transparent plants have the heaviest plants overall. Opaque looks the least promising with a lower mass than the control results.
Analysis
Analysis
This section describes the analysis for this experiment.
TukeyHSD Analysis
In our experiment we used R Studio to allow us to run a one-way TukeyHSD (honest significant difference) test. This test determines if our results were statistically significant.
95% Confidence Level
This section shows the results of the TukeyHSD test on a 95% confidence level. This means that there is a 95% chance that the intervals the table is showing are correct in their statistical significance.
Height
The figure below shows the significance of the data compared to each other.

Figure 12 - 95% Confidence TukeyHSD Test Height Results
Table 10 - 95% Confidence Intervals for Height
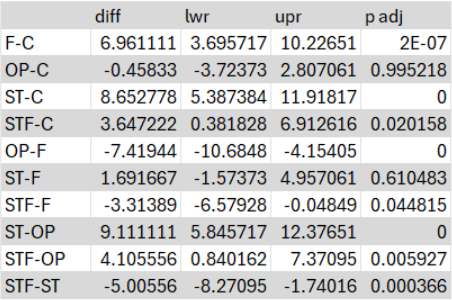
This table shows the numerical values for the TukeyHSD test. The diff column represents the difference in means between two groups, with lwr and upr representing the maximum and minimum differences in mean, with a 95% confidence. P adj is the confidence that the data is statistically significant, or has a high chance of one case having more weight/height then another case. The closer the P adj is to 0 the more confident we are to reject the null hypothesis (Scribbr, N/A)
This data shows the most statistical significance between semi-transparent and control, semi-transparent and opaque, and film and opaque. These comparisons showed a higher difference in data.
The most significant data is semi-transparent and opaque. This shows that semi-transparent plants are taller plants than opaque by a larger amount. This suggests that the semi-transparent has a greater mean than the opaque results.
The least statistically significant data was between the opaque and the control. In this comparison neither of them have a clear greater mean than the other showing that there is no statistical significance between the two. This data suggests that either of these cases would have a chance of outgrowing the other in height.
Mass
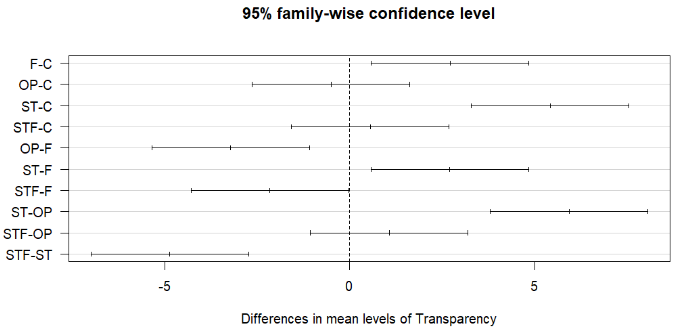
Figure 13 - 95% Confidence TukeyHSD Test Mass Results
Table 11 - 95% Confidence Intervals for Mass
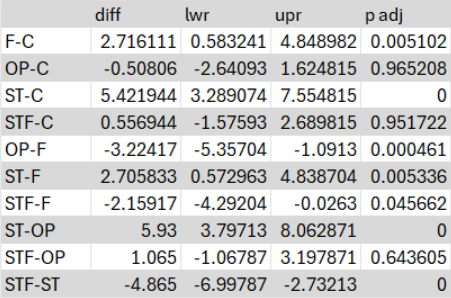
This data shows the most statistical significance between the semi-transparent and the control, the semi-transparent and opaque, and semi-transparent and semi-transparent with film. This shows that semi-transparent has the most mass when compared to other cases.
Semi-transparent to opaque has the most statistical significance. This is because the difference is the highest when compared to the other differences. This shows that semi-transparent has a significantly higher mass than opaque as well as semi-transparent with film and control.
The least difference occurred between opaque and control. This shows that the mass is similar between the two cases and both have the potential to weigh more than the other. The difference is the closest to 0 showing that there is statistical significance between the two cases.
Mass Per Plant
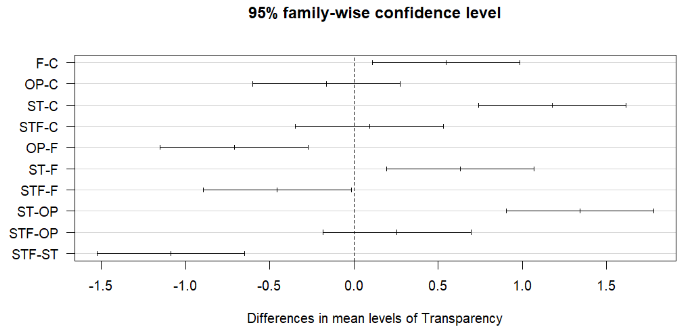
Figure 14 - 95% Confidence TukeyHSD Test Mass per Plant Results
Table 12 - 95% Confidence Intervals for Mass Per Plant
The mass results show similar outcomes to this section of the experiment. The most statistically significant data was semi-transparent and control, semi-transparent and opaque, and semi-transparent and semi-transparent with film. This shows that the higher differences in means occurred between these cases when compared.
Again, semi-transparent and opaque show the greatest statistical difference. This suggests that semi-transparent has the largest difference compared to when the other cases were compared to each other. Semi-transparent has more potential in having a higher mass per plant because of the solar panel when compared to the fully covered opaque solar panel.
Semi-transparent with film and control had the least statistical significance. This suggests that the semi-transparent with film, when measuring each plant individually, will have less mass when compared to other cases. Semi-transparent measurements per container will have more statistical significance when compared to other options versus when measuring the mass of each individual plant.
99% Confidence Level
This section shows the results of the one-way TukeyHSD on a 95% confidence level. This means that there is a 95% chance that the intervals the table is showing are correct in their statistical significance.
Height
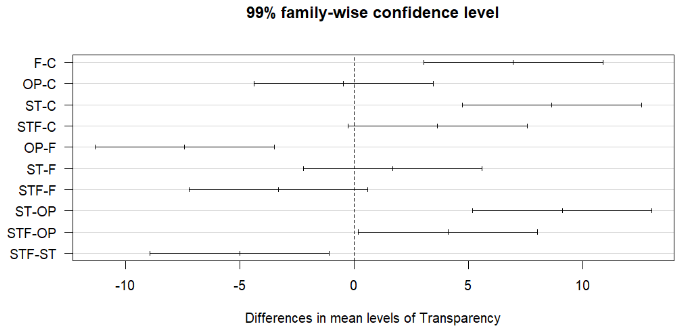
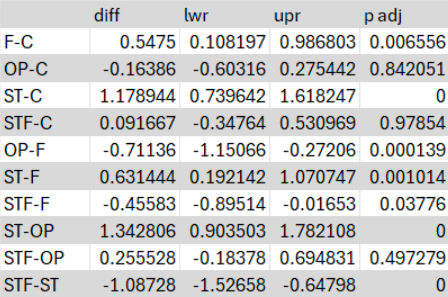
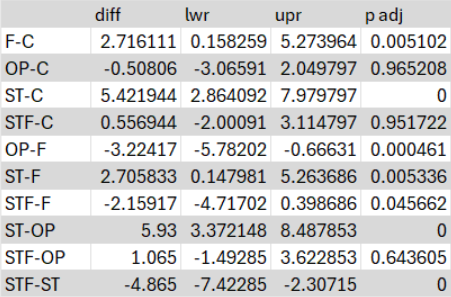
Figure 15 - 99% Confidence TukeyHSD Test Height Results
Table 13 - 99% Confidence Intervals for Height
These tables show similar results as the 95% confidence levels. These tables determine if certain cases are still statistically significant. Semi-transparent with film and control was originally statistically significant at 95% but now does not appear statistically significant at 99%. This helps determine if certain cases still have statistical significance at 99% and can prove one case is taller than the other.
Semi-transparent and control, film and opaque, and semi-transparent and opaque are still statistically significant because of the largest difference in mean. For these cases we can statistically reject the null hypothesis.
Mass
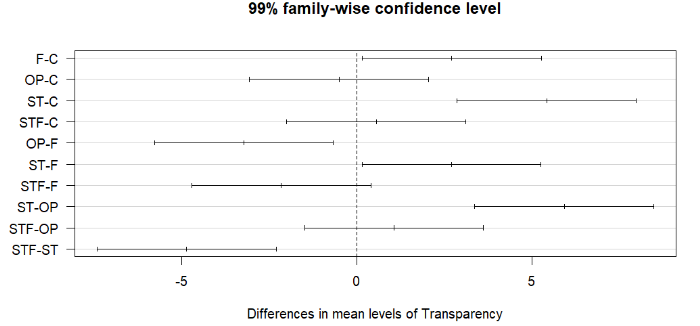
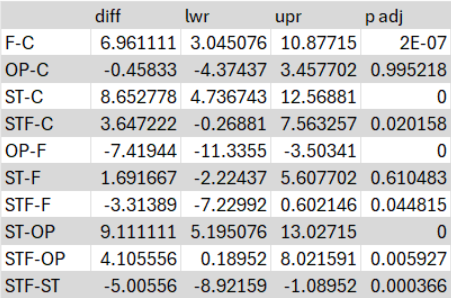
Figure 16 - 99% Confidence TukeyHSD Test Mass Results
Table 14 - 99% Confidence Intervals for Mass
Similar to mass at 95% confidence the semi-transparent and control, semi-transparent and opaque, and semi-transparent and semi-transparent with film as the most statistically significant. This is because of the major difference in mean. This shows these three cases and confidently rejects the null hypothesis.
Semi-transparent with film and film is the only case to now become non-statistically significant. This shows that the results mostly show statistical significance but only up to a certain point. At 99% there is no significant difference between these two cases.
Mass Per Plant
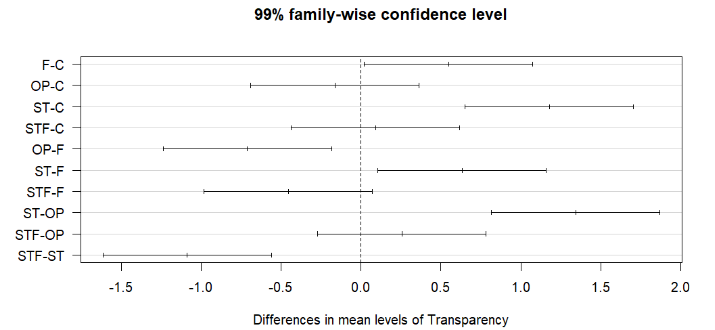
Figure 17 - 99% Confidence TukeyHSD Test Mass per Plant Results
Table 15 - 99% Confidence Intervals for Mass per Plant
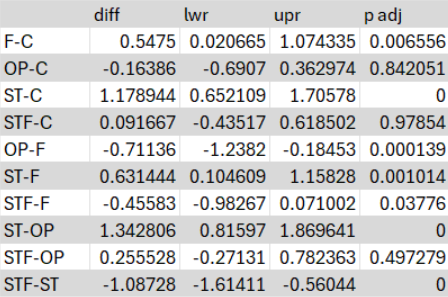
The results for this case show similar results to mass per plant under 95% confidence. The semi-transparent and control, semi-transparent and opaque, semi-transparent with film and semi -transparent still show the most statistical significance. This suggests that these cases reject the null hypothesis.
Semi-transparent with film and film is the only case that does not share any statistical significance from 95% to 99%. This shows that the mean did not show enough difference to prove statistical significance at 99%.
Conclusion
Conclusion
This section describes the conclusion for our report. After planting 1080 seeds we can conclude overall, a semi-transparent solar panel will grow the tallest and the heaviest plants for mustard crops. This shows that the semi-transparent will therefore offer the greatest yield for the farmers for this crop.
Height of the Plants
The results show that the tallest plants grew under the semi-transparent solar panel with the film offering the next tallest crops. Using the TukeyHSD statistical analysis we proved that we can reject the null hypothesis when compared to control, opaque, and semi-transparent with film. The film is not statistically significant when compared to the semi-transparent with film at a 99% confidence rate. These results show promising outcomes toward semi-transparent producing the highest growing crop, influencing its yield.
The results show the opaque and control result in the least plant growth. This proves that agrivoltaics should not be used with fully covered solar panels but shows promise that agrivoltaics can help the height of the plant when using half covered panels with solar cells.
Mass of the Plants
The results show that the heaviest plants grew under the semi-transparent panels. The statistical analysis showed, similar to height, the rejection of the null hypothesis when semi-transparent was compared to control, opaque, and semi-transparent with film. This suggests that the plants will grow more mustard seeds if using agrivoltaics. The case using only film produced the second heaviest plants. This suggests that the film helped plant growth, but not to the extent that the semi-transparent showed.
The control and opaque showed the plants with the least mass. When compared to the other plants they were significantly smaller, reducing the amount of mass they will continue. This shows promise in agrivoltaics when the solar panels did not block a significant amount of light.
Overall Conclusion
A semi-transparent solar panel will most effectively gather renewable energy while growing the heaviest and tallest plants.
Agrivoltaics can improve the yield of crops. A high opacity of solar cells not utilizing agrivoltaics will limit the yield of crops. Agrivoltaics can help Canada increase our renewable energy production as well as increasing the yields of crops.
Application
Applications and Future Work
This section describes our future work and the impacts of agrivoltaics in the real world.
Impacting the World
This section describes how agrivoltaics benefits today's agriculture and renewable energy production.
Land Space in Alberta
In Alberta, we focus on agriculture and energy production as one of our major sources of revenue. If we could utilize both simultaneously, this would benefit our province. We have found a solution to improve the effectiveness of our land use, because of the limited space for agriculture and renewable energy.
One of the major topics in the economy today is efficiency. Agrivoltaics can reduce the pressure on identifying new land space while increasing crop yield. Using agrivoltaics shows is a promising technology for land re-use.
Energy Production
Agrivoltaics has the potential for agriculture and renewable energy to work in unison. This means that the electricity produced can be used to help support farmers or sold to the electrical grid. This renewable energy can help reduce the cost to run water for the crops and electricity for the machines that are used.
Environmentally Friendly
Agrivoltaics helps improve our environment. The electricity used to harvest the crops and water them daily will emit greenhouse gasses because of the fossil fuels used to run the machinery. Solar panels offer a renewable source of energy that can help replace the use of fossil fuels on farms. This helps the use of renewable versus non-renewable energy in Alberta. Preventing natural gas and fossil fuels from being utilized as a major source of energy will in the long term, contribute to fighting climate change.
Crop Benefits
This section elaborates on the crop benefits while using agrivoltaics
Water
Agrivoltaics provides many benefits to crops including:
- Less water needed for the plant
- With solar panels acting as shade evaporation is reduced
- Improved humidity
- Solar panels block some direct sunlight helping the air under the panels stay more humid
Reduced water usage decreases the water cost (Repsol, 2023).
Increased Yield
A variety of sources state the benefits of agrivoltaics through the yield of crops. Many plants around the world benefit from some shade from the sun. Agrivoltaics can offer this to a certain extent. Our project helped determine which level of transparency of solar panel would increase the yield the most. With the information gathered throughout this experiment we have determined the most effective way to use solar panels while increasing the crop yield. This can help the potential of agriculture and renewable energy to be used more prominently in today's society.
Protection from Weather
Using agrivoltaics can give protection to the plants underneath it. Many crops can be destroyed by droughts or hail storms. Solar panels can help provide protection to the plants and prevent them from being damaged in severe hailstorms. Droughts are minimized by the excess shading the panel is giving. This helps reduce the amount of water evaporating from the plant, allowing farmers to water less frequently.
Soil Erosion
Agrivoltaics can help eliminate soil erosion. The shade of the solar panels can help prevent water loss from the soil through evaporation. This increases the amount of water in the soil which the plants can obtain through root systems. This helps stabilize the soil and fight against the soil erosion that farmers may experience. (Time, 2024)
Future Work
Our project tested the growth of mustard seeds using different transparencies of solar panels. This is only a small portion of the potential of agrivoltaics. This section will describe the future work that could be done.
The Solar Panel Variable
This experiment can be expanded beyond the transparency of solar panels. One major test is the height of the solar panels. Varying the height could affect the following variables:
- The amount of light the crops receive
- The amount of electricity the solar panels could produce
- The dryness of the soil
- The amount of evaporation occurring with the crops
- The humidity of the air under the solar panels
This would be an extension, testing different variables that may affect a plant's growth.
The Crop Used
Many different species and categories of plants are grown in Canada. Testing the effect of agrivoltaics on different crops will provide information on the most efficient transparency, height, etc. for certain crops. For example, conducting this experiment on wheat or canola would be a good extension.
Varying Conditions Surrounding the Plants
Many factors impact the growth of plants. The solar panels might influence these factors (for better or for worse) and testing these variables can better understand the optimal conditions for agrivoltaics. Many conditions that impact plant growth and how agrivoltaics could have impact are:
- Humidity of the atmosphere - solar panels increase humidity because of the reduced heat that may remove water vapor under the panels
- Carbon dioxide in the atmosphere - solar panels could prevent the constant exchange of gasses directly from the plants to the surrounding environment
- Soil fertility - the sun can block the soil from direct sunlight, this can allow the soil to provide nutrients the plants need without drying out
- Heat in the atmosphere - the solar panel can help block direct heating from the sun, this helps plants reduce their evaporation
This list describes the major atmospheric conditions that may be varied. Other factors that contribute to the growth of crops may also be varied to provide results on if agrivoltaics helped or hurt plant growth.
Sources Of Error
Sources of Error
5 sources of error were identified in this project:
- Amount of soil was determined using measuring cups
- This could slightly vary from container to container
- Some seeds do not have the certain genetics to grow
- This may have affected the results in certain cases
- Small root hairs not included in measurements
- Smaller root hairs could not be separated from the soil without removal entirely
- This have slightly impacted the weight of the plants
- Smaller root hairs could not be separated from the soil without removal entirely
- Plants were rinsed in water and then dried
- Leftover water in the plants may have varied
- Height could only be accurately measured to the nearest tenth of a centimeter
- This added variation to the results as more decimals could not be included for these results
Citations
References
Hall, S. (2022, October 28). Can crops grow better under solar panels? Here’s all you need to know about ‘agrivoltaic farming’. Retrieved from World Economic Forum: https://www.weforum.org/agenda/2022/07/agrivoltaic-farming-solar-energy/
Woods, J. (2010, September 27). Energy and the food system. Retrieved from National Library of Medicine: https://www.ncbi.nlm.nih.gov/pmc/articles/PMC2935130/#
Pearce, J. (2023, September 25). This Renewable Energy Should Please Even Alberta’s UCP. Retrieved from The Tyee: https://thetyee.ca/Analysis/2023/09/25/Agrivoltaics-Renewable-Energy-Alberta/
Pearce, J. (2023, September 25). The unexpected reason$ farmers are planting crops under solar panels. Retrieved from Ivey: https://www.ivey.uwo.ca/sustainability/news/2023/09/the-unexpected-reason-farmers-are-planting-crops-under-solar-panels/#
Widmer, J. (2024, March). Agrivoltaics, a promising new tool for electricity and food production: A systematic review. Retrieved from ScienceDirect: https://www.sciencedirect.com/science/article/pii/S1364032123011358
Enel Green Power. (n.d.). All the benefits of agrivoltaics. Retrieved from Enel Green Power: https://www.enelgreenpower.com/stories/benefits-agrivoltaics
Bourdeau, J. (n.d.). 5 Disadvantages That Prevent Widespread Deployment Of Agrivoltaics. Retrieved from TheMomentum: https://www.themomentum.com/roundups/5-disadvantages-that-prevent-widespread-deployment-of-agrivoltaics
Repsol. (2023, November 9). Contributing to achieving a sustainable primary sector. Retrieved from Repsol: https://www.repsol.com/en/energy-and-the-future/future-of-the-world/agrivoltaics/index.cshtml#
Federica, B. (2018, March 29). Characterisation of bioactive compounds in berries from plants grown under innovative photovoltaic greenhouses. Retrieved from IOS Press: https://content.iospress.com/articles/journal-of-berry-research/jbr170258
CBC News. (2023, May 11). Simulations in agri-voltaics suggest Canadian farms could one day double as giant solar batteries. Retrieved from CBC News: https://www.cbc.ca/news/canada/london/solar-panel-crops-agri-voltaics-canada-1.6832870
Jamil, U. (2023, February 10). The Agrivoltaic Potential of Canada. Retrieved from MDPI: https://www.mdpi.com/2071-1050/15/4/3228
Time, A. (2024, January 11). Conservation agrivoltaics for sustainable food-energy production. Retrieved from Plants People Planet: https://nph.onlinelibrary.wiley.com/doi/full/10.1002/ppp3.10481#
Moon, H. (2022, June 12). Agrivoltaic Systems Enhance Farmers’ Profits through Broccoli Visual Quality and Electricity Production without Dramatic Changes in Yield, Antioxidant Capacity, and Glucosinolates. Retrieved from MDPI: https://www.mdpi.com/2073-4395/12/6/1415
Dupraz, C. (2011, April 12). Combining solar photovoltaic panels and food crops for optimising land use: Towards new agrivoltaic schemes. Retrieved from ScienceDirect: https://zero.sci-hub.se/383/5bd5d3cefe2d4cefe8bb58dd18c32a59/dupraz2011.pdf
MountainView Today (2021, September 20) Alberta Mustard is on the World’s Plate. Retrieved from MountainView Today: https://www.mountainviewtoday.ca/lets-eat-alberta/alberta-mustard-is-on-the-worlds-plate-4360466
Scribbr. (Accessed: 2024). What is a p-value? Retrieved from Scribbr: https://www.scribbr.com/frequently-asked-questions/what-is-a-p-value/
Scribbr. (2023, June 2022). ANOVA in R | A Complete Step-by-Step Guide with Examples. Retrieved from Scribbr: ANOVA in R | A Complete Step-by-Step Guide with Examples (scribbr.com)
Acknowledgement
Acknowledgements
This section describes the individuals and companies who supported us during the experiment.
- The company of UbiGro for offering a free sample of their film to be utilized in our experiment
- Dr. Joshua Pearce at Western University for allowing us to meet and discuss with about our project and his projects and acting as our mentor for this project
- He acknowledged the topics of background research, application, and future work giving us ideas to incorporate into our report
- Mrs. Friesen the Tom Baines science fair coordinator for signing us into CYSF and answering questions as needed
- Miss Bretner the STEM Innovation Academy science fair coordinator for answering questions
- Ella’s family (Craig and Sarah McFarland) for helping set up the track in their basement for the robot and allowing us to grow mustard seeds in their storage room
- Ariel’s Dad (Chris Mason) for editing the report