Obtaining a High Resolution Spectrum of the Sun and comparing it to a G2V star
Anish Thakur
Sameer Thakur
Grade 8
Presentation
No video provided
Hypothesis
My project hypothesis is that there will probably be some minor differences in the spectrum of the Sun and the average G2V star. Since the sun is a G2V star, I think that most of the lines will match up, but I still think that there might be some minor differences in some of the absorption lines.
Research
Star Types
Categorization by Temperature (Classifying stars by surface temperature)
O (Blue) >30\,000 K
B (Blue-white) 10,000–30,000 K.
A (White): 7,500–10,000 K
F (Yellow-white): 6,000–7,500 K
G (Yellow): 5,200–6,000 K
K (Orange): 3,700–5,200 K
M (Red): <3,700 K
Temperature Subdivisions (goes from 0-9)
0 indicates the hottest star within a class
9 indicates the coolest star within a class
Sequence example: B0, B1, B2, B3, B4...
Categorization by Luminosity (Classifying Stars by Size)
0 or Ia+: Hypergiants
I: Supergiants.
II: Bright Giants.
III: Regular Giants.
IV: Subgiants.
V: Main-Sequence Stars (Dwarfs) – Includes 90% of all stars, including the Sun (G2V).
VI/sd: Subdwarfs.
D/VII: White Dwarfs (Remnants).
How to classify a star type using a spectrograph
Absorption Lines
O-type stars: These stars are so hot that most atoms are ionized. Their spectra show lines of ionized helium.
A-type stars: These types of stars have the strongest hydrogen Balmer lines
M-type stars: These stars are cool enough for molecules to exist, so their spectra usually have molecular bands like titanium oxide.
Spectrographs
Spectrographs break up light into their indivisual wavelengths. They accomplish this using either a prism or a diffraction grating (for my example, the latter). Light goes in through the slit and hits a collimator lens (a convex lens). This lens makes the uneven beams of light straight, so that when they enter the diffraction grating, they will be even. The diffraction grating then splits these light beams into their component wave. This data goes into a photodetector, which feeds it into a computer. This data is processed into a 1D spectrum that can be viewed and analyzed. Any waves that rise above the general trend are emission lines, and any that are under are absorption lines.
Fraunhofer lines
Fraunhofer lines are dark absorption lines found in the optical spectrum of the Sun and other stars. They occur because gases in the stellar atmosphere absorb specific wavelengths of light. William Hyde Wollaston first observed these lines in 1802. Joseph von Fraunhofer mapped them in 1814. These lines serve as a chemical fingerprint that helps identify elements such as hydrogen, helium, and sodium in stellar atmospheres. Fraunhofer lines are formed when light from the photosphere (the surface of the sun) is absorbed by cooler gases in the outer layers of the sun.
Variables
Controlled Variables
- Slit to Grating distance
- Grating to Camera distance
- Camera Lens focal length
Dependent Variable
- Exposure time for each section of the spectrum\, as camera sensitivity changes with the wavelenght I needed to adjust exposures.
- Blue End of the spectrum required shorter exposures than the red end of the spectrum
Independent Variable
- The spectra of the G2V star and the spectrum of the Sun.
Procedure
Construction of a Spectrograph
Parts used
- Optical Slit - 7 micron
- Reflection Grating: 2400 lines/mm
- DSLR Camera with lens
We did print the Slit holder and the Grating holder on a 3D printer, and everything was fixed to a plywood board.
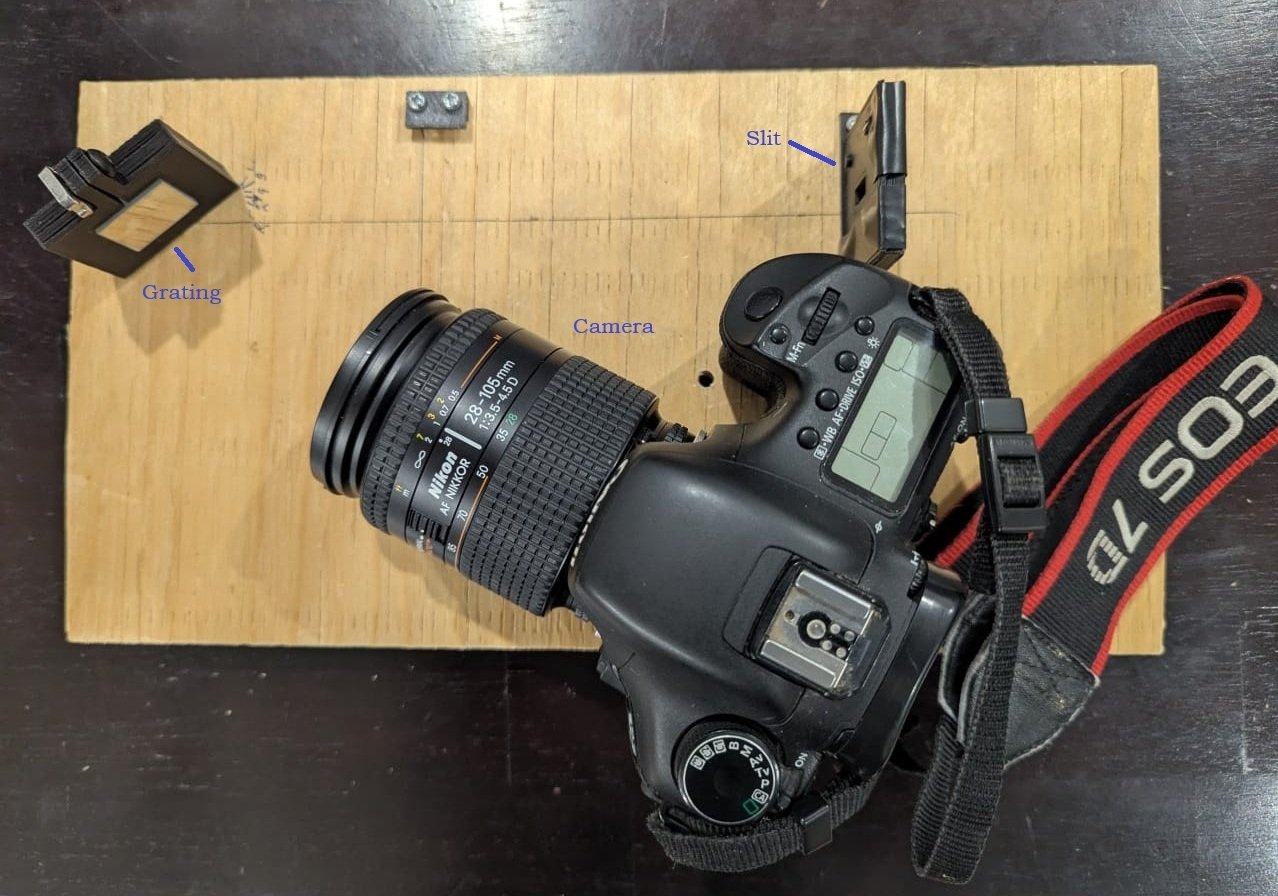
The original design of the spectrograph contains a collimator lens too; however, with a collimater the resulting spectrum was too high resolution, so I removed it. As the slit itself is very narrow, even without a collimator, I could get a high-resolution spectrum and still needed to take 6 photos to cover the complete visible spectrum.
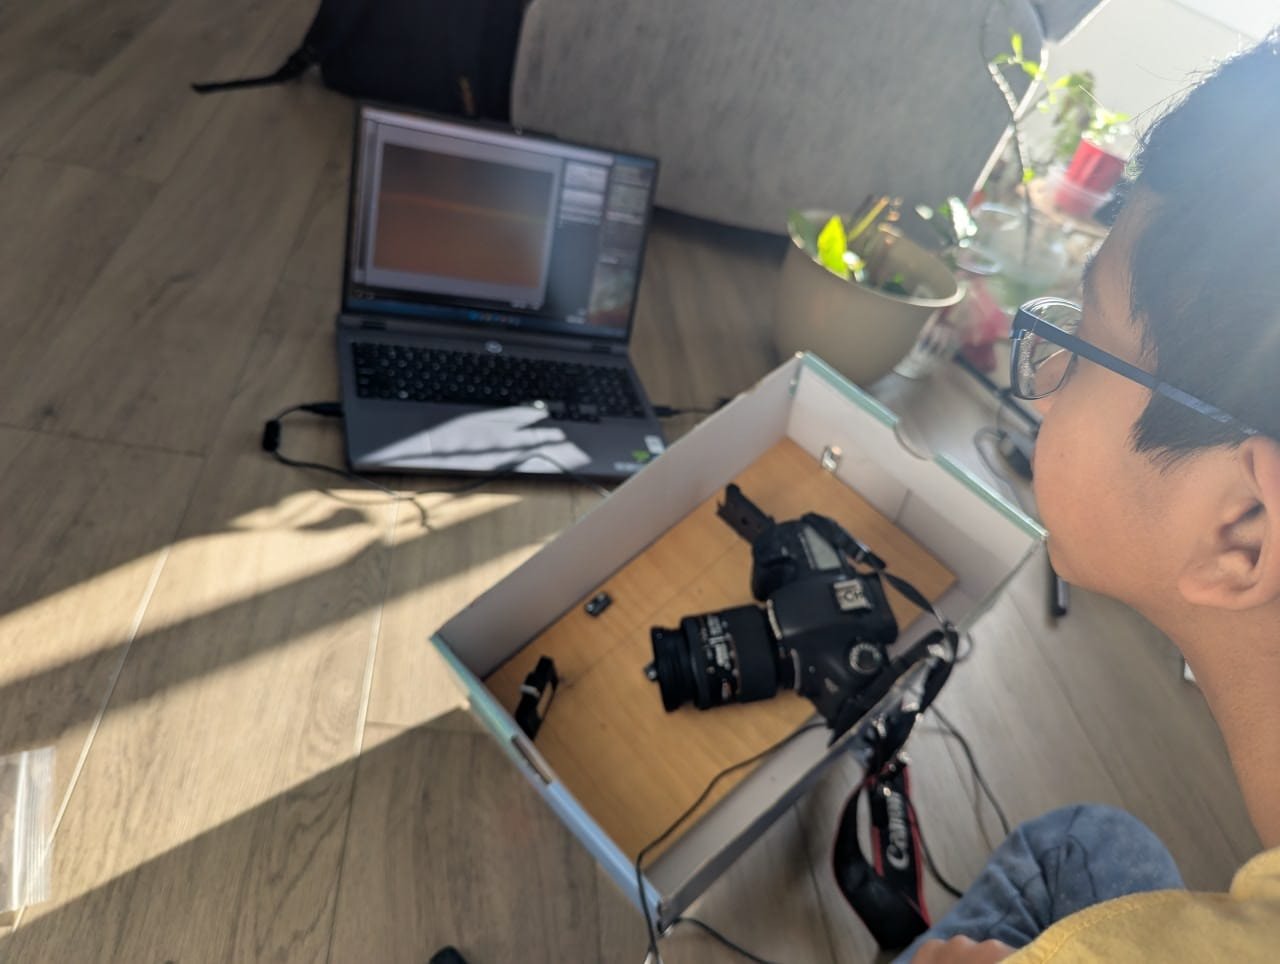
Capturing the Spectrum of the Sun
To capture the spectrum, I used Canon EOS Utility software to control the camera so that I could focus the spectrum on the laptop and get an accurate focus.
I put the spectrograph into a shoe box and cut a small window into it to let light fall only on the slit, thereby getting the required contrast in the spectrum.
As a single photo covers only a small portion of the spectrum, I have to take multiple photos by tilting the grating gradually for each photo.
Observations
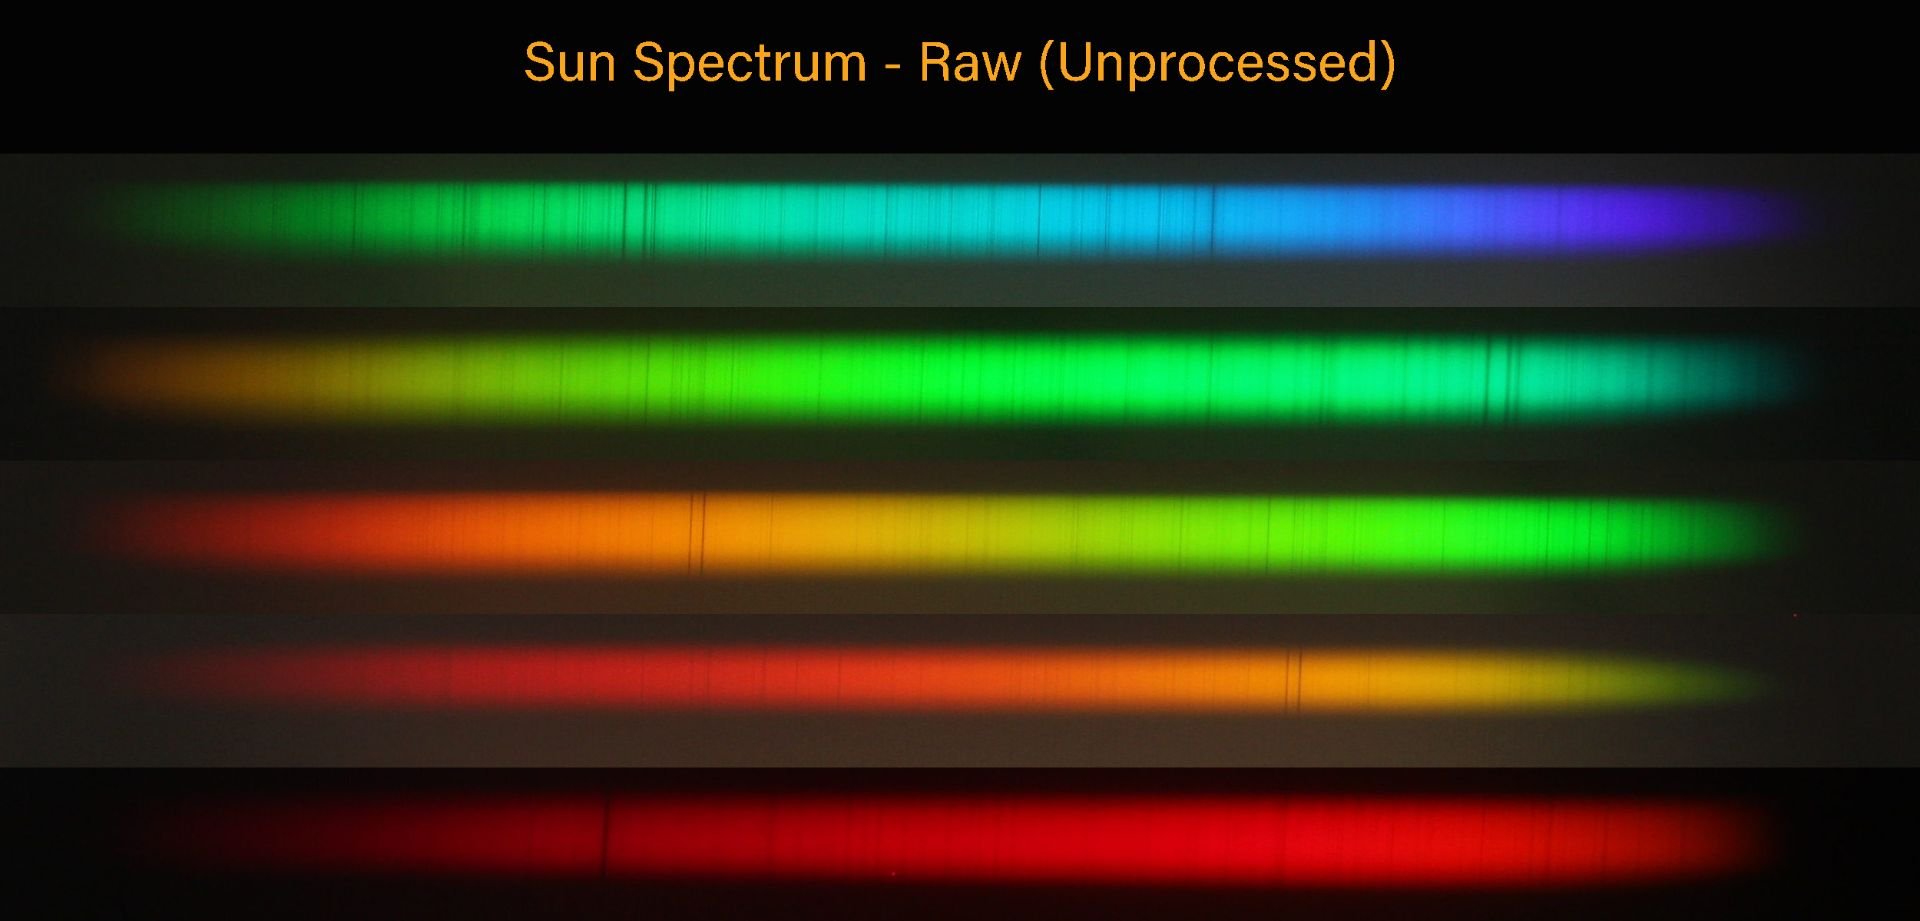
Observations / Data collection
The following are the final photographs of the spectrum that I captured with a spectrograph. This is raw data (unprocessed images)
In order to prepare data for analysis, I cropped images to keep only the spectrum part of the images.
The pic below is an assembled pic of 6 different photographs.
We will process this data in the analysis section.
Analysis
Software used for analysis: RSpec
I obtained a trial version of this software.
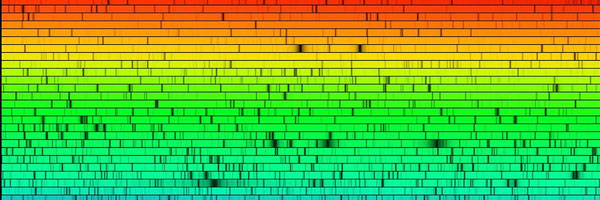
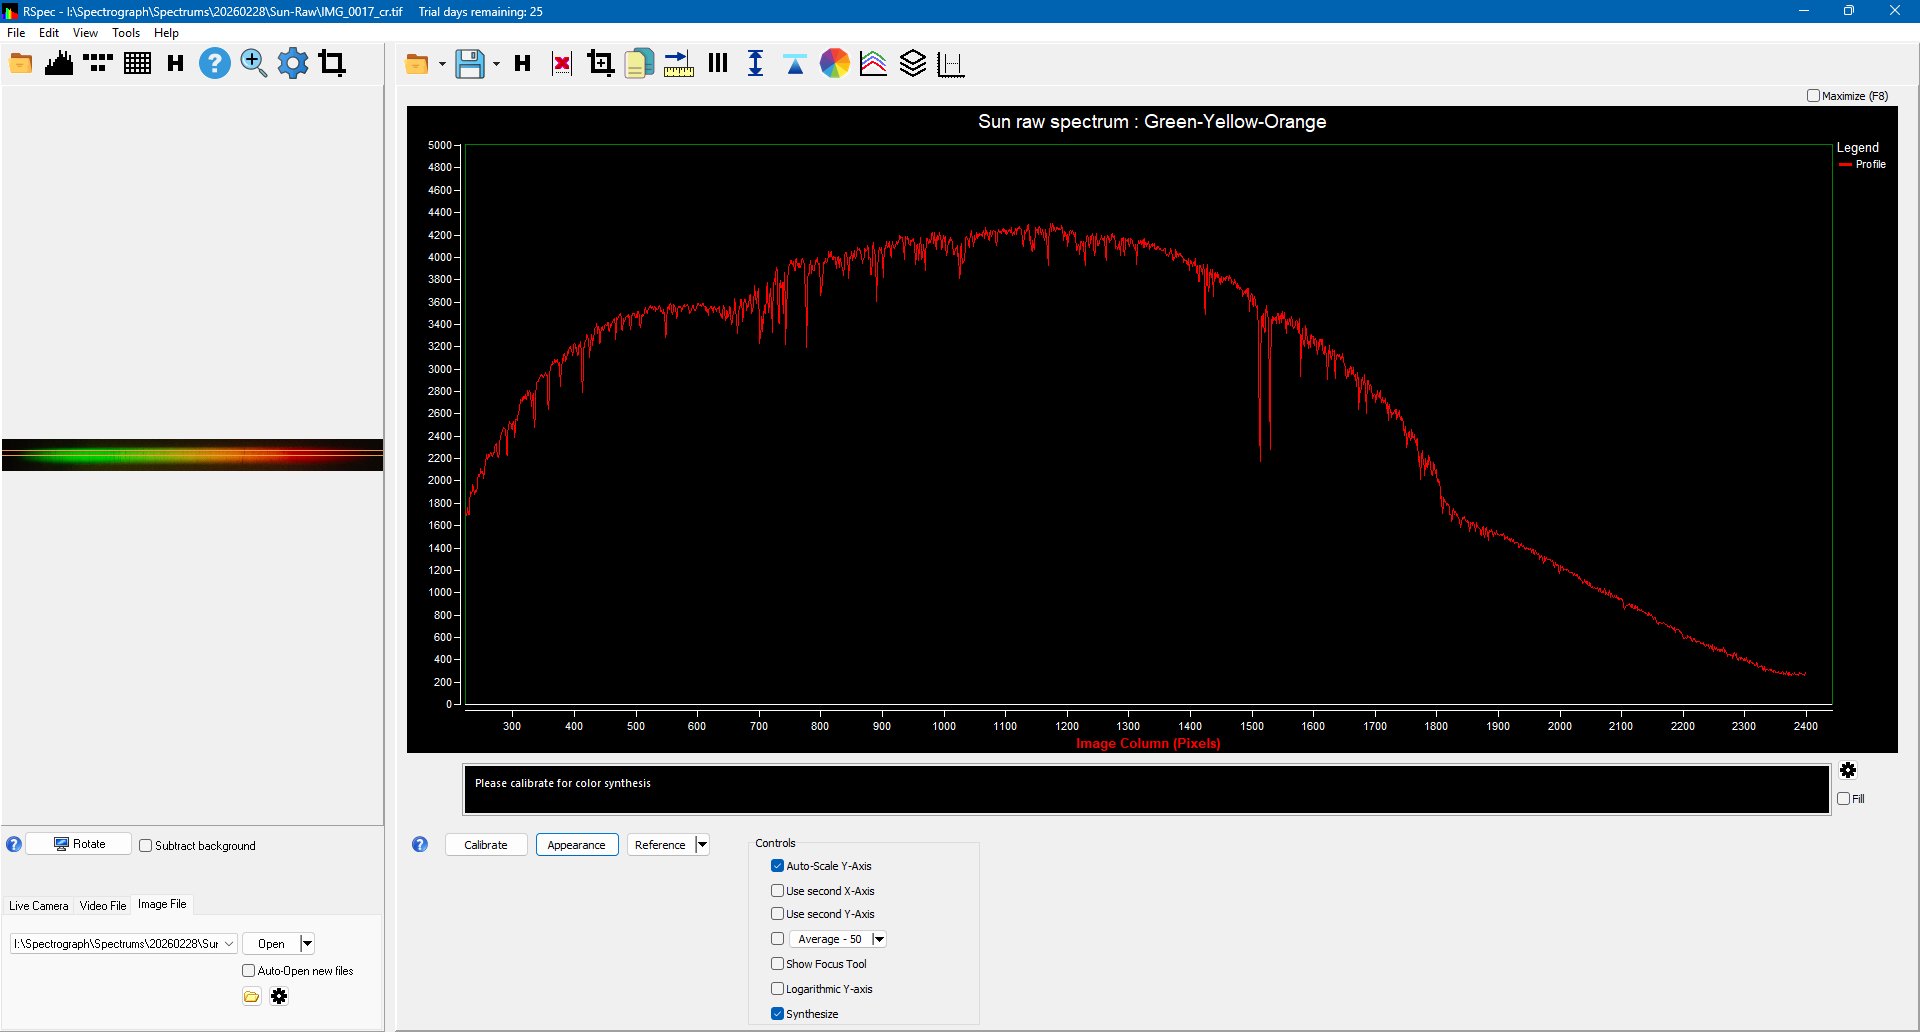
The raw Spectrum photo is opened in the RSpec software.
Raw spectrum is just a pixel and an intensity graph; we need to convert this to a wavelength and intensity graph, which is the calibration process.
In RSepc, we can calibrate the spectrum by assigning wavelengths to known points on the graph.
I used the "Liege Solar Spectral Atlas" to match prominent absorption lines in my captured spectrum and determine their wavelengths for calibration.
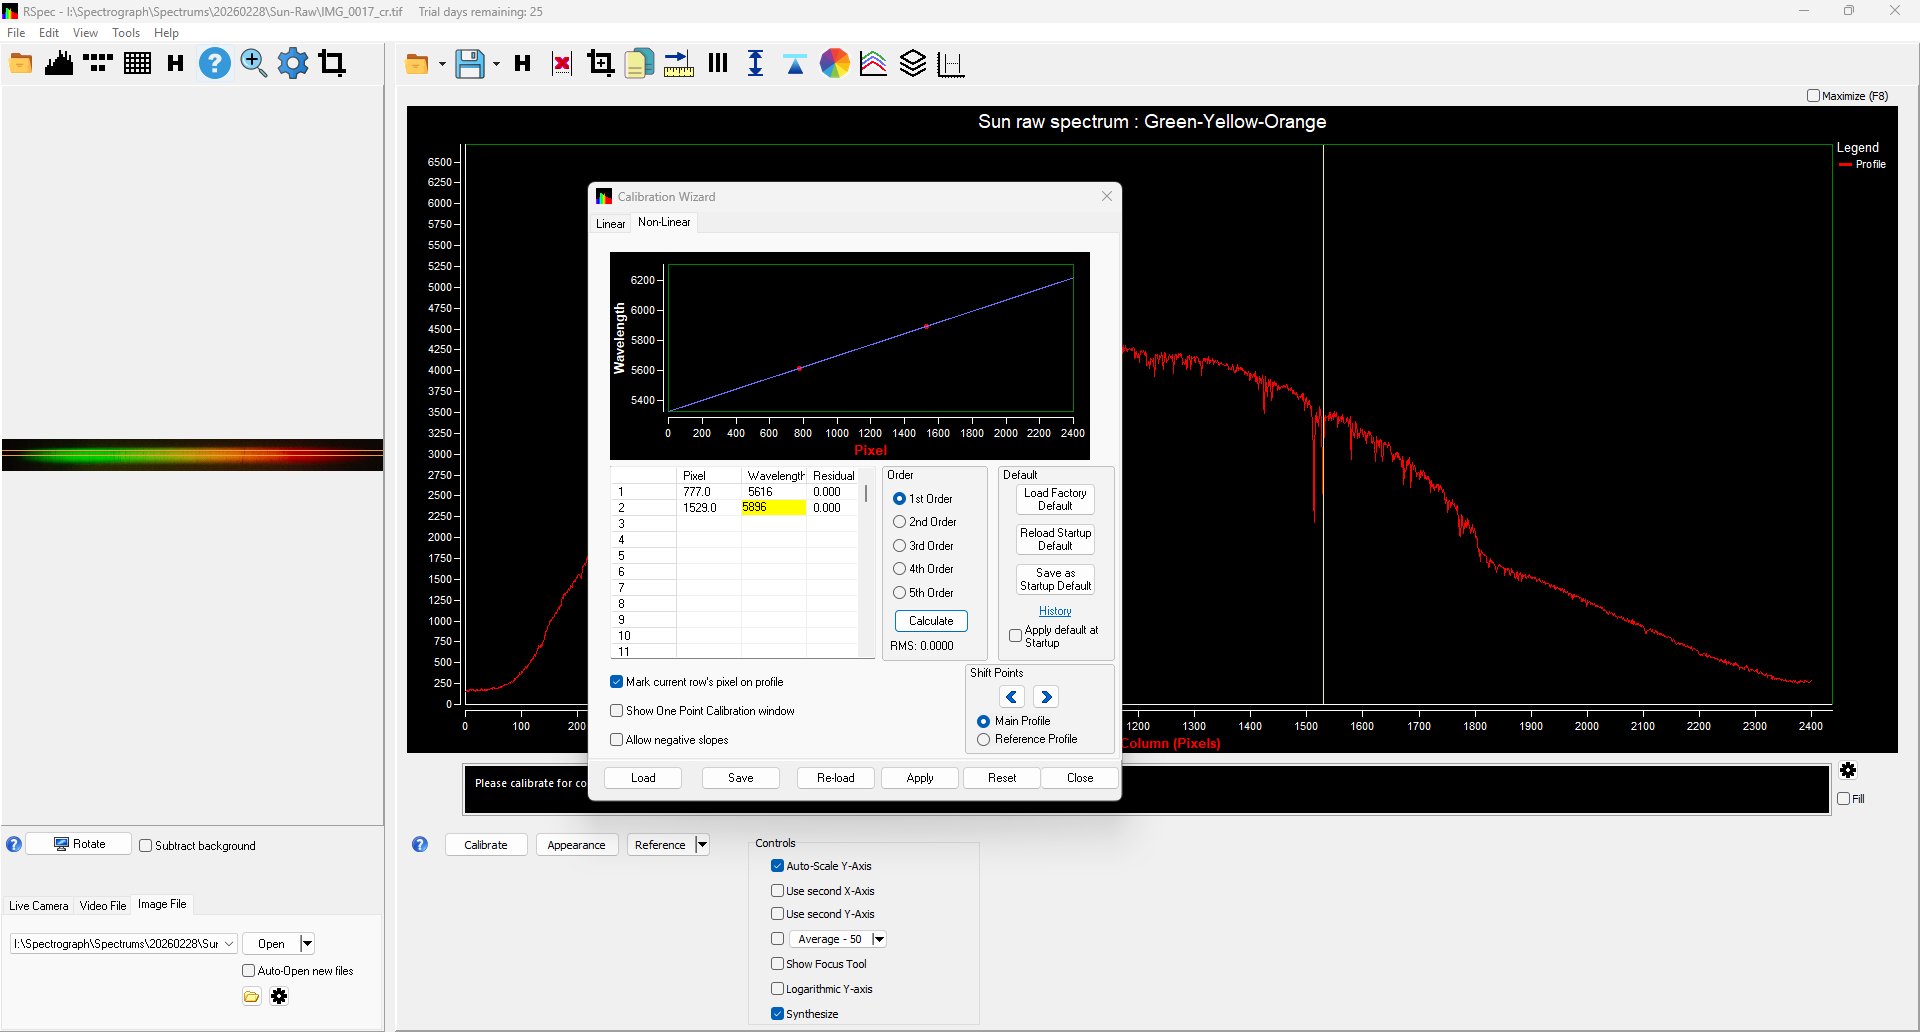
Once the Graph points are assigned a wavelength, the whole graph gets calibrated.
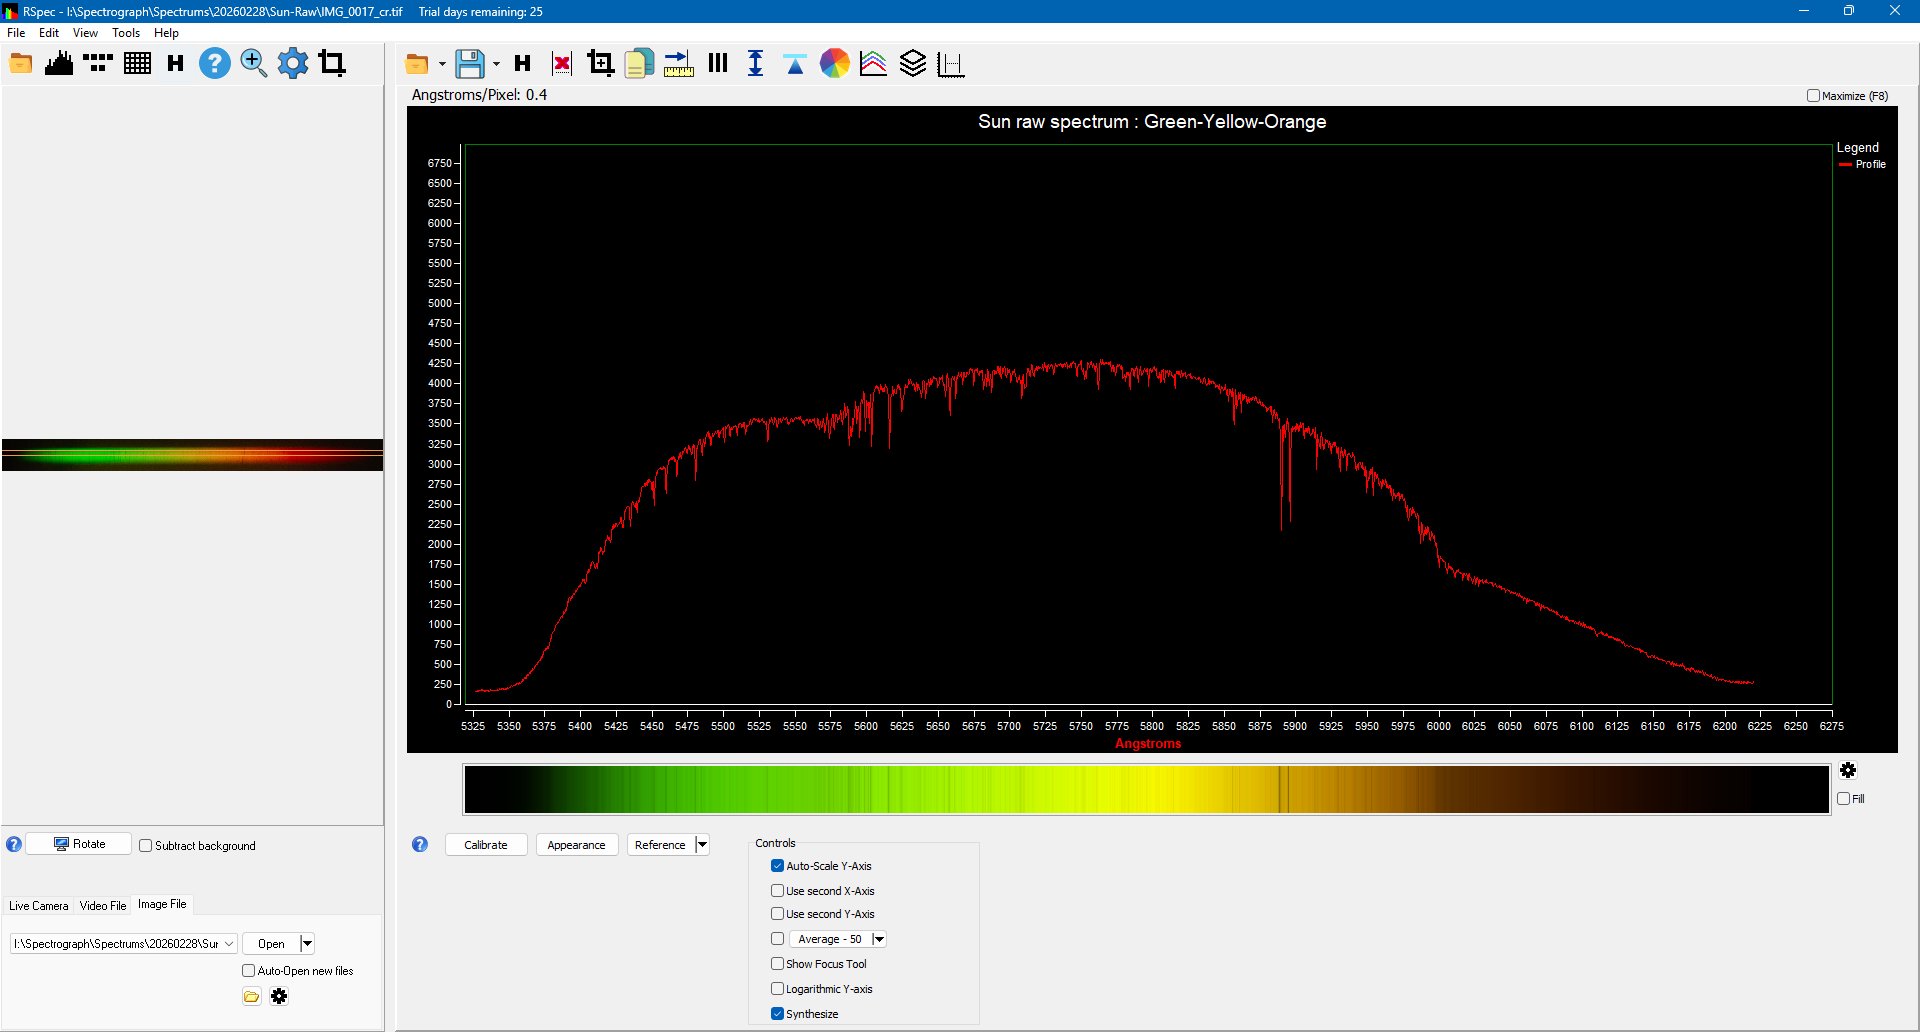
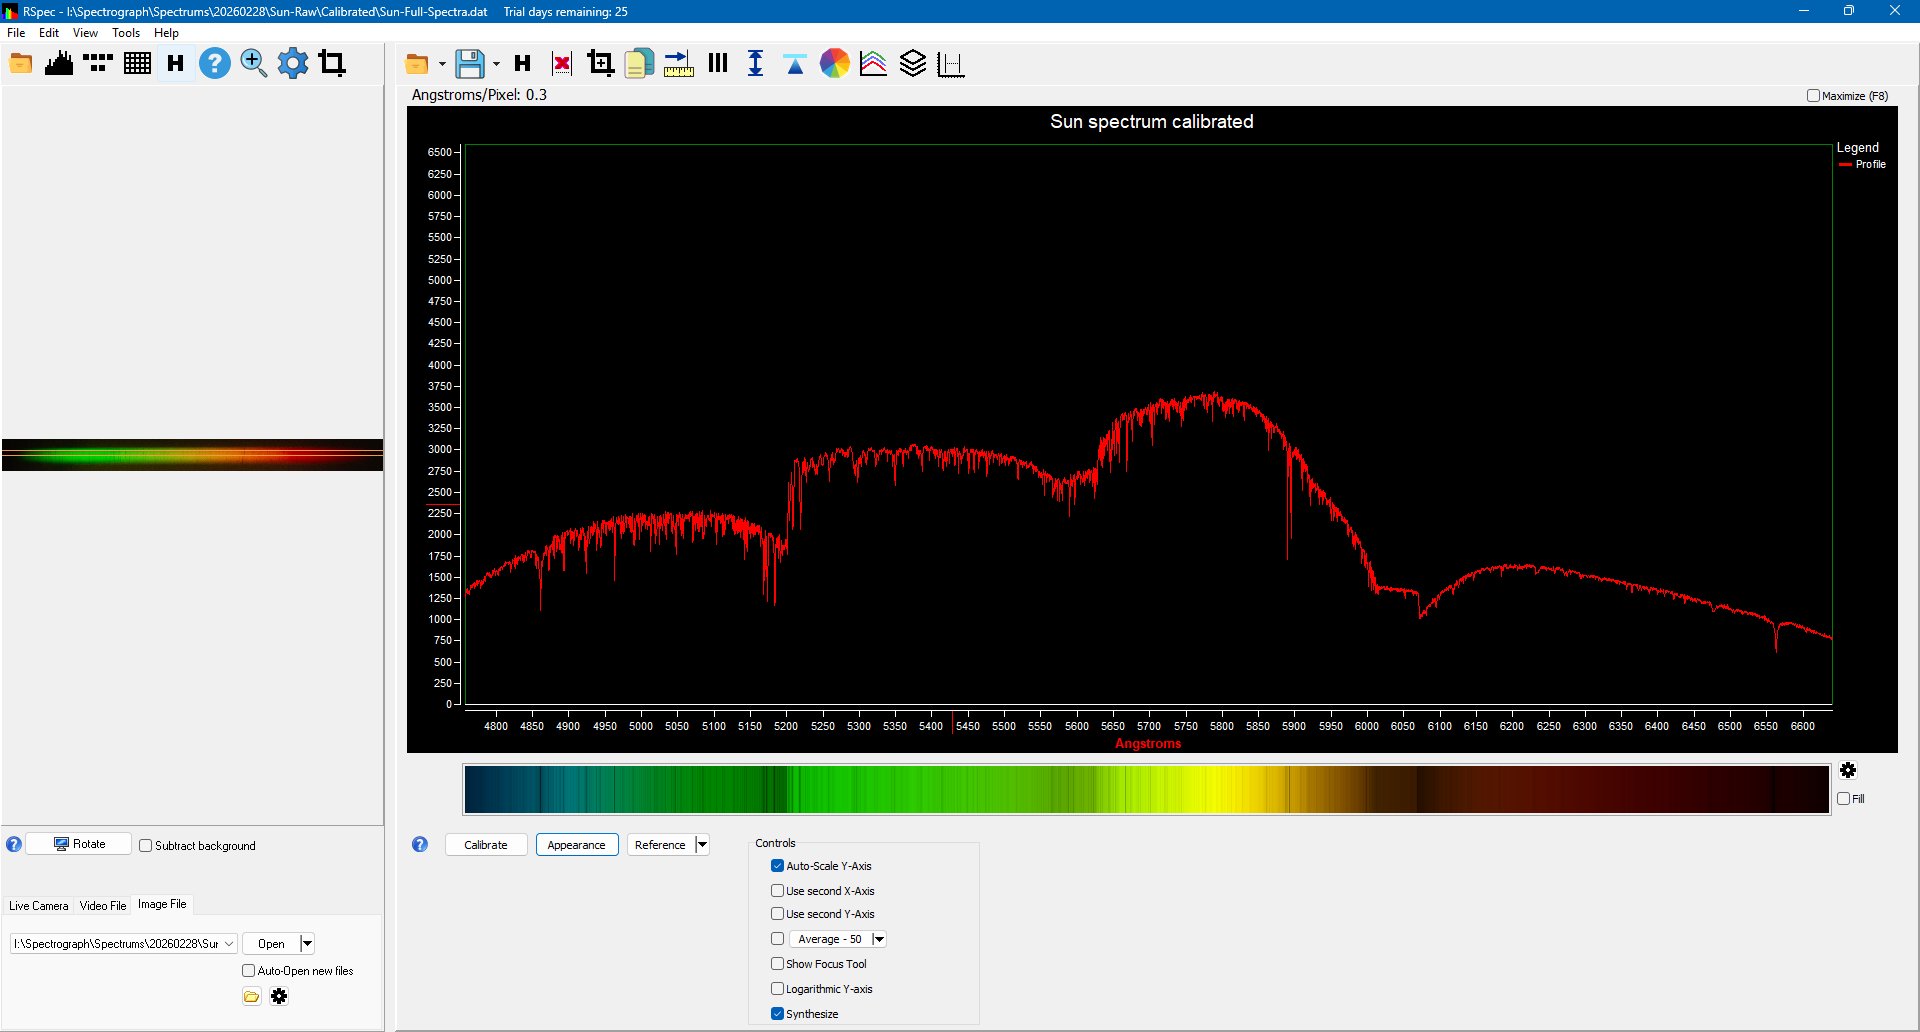
This graph is now calibrated for wavelengths; But it is not yet fully calibrated, as we can see in the above graph, the intensity falls off at both corners. This is due to vignetting due to instrument setup, and also where at the center there is more light, and at the corners, light intensity drops.
We will calibrate this graph later, after combining all sections of the spectrum to get a full spectrum in a single graph.
Combining spectrums
RSpec Calibrated spectrums are basically text files that contain wavelength and intensity values. We can combine those manually by deleting overlaps of wavelengths in different spectrums and making a single file.
4617.294434 1264
4617.715332 1283
4618.136230 1331
4618.557129 1350
4618.978027 1349 .
.
.
6613.695313 765
6614.021973 775
6614.349121 787
6614.675781 787
6615.002930 781
Once the spectrum files are combined into one, we can open the full spectrum in RSpec for instrument calibration.
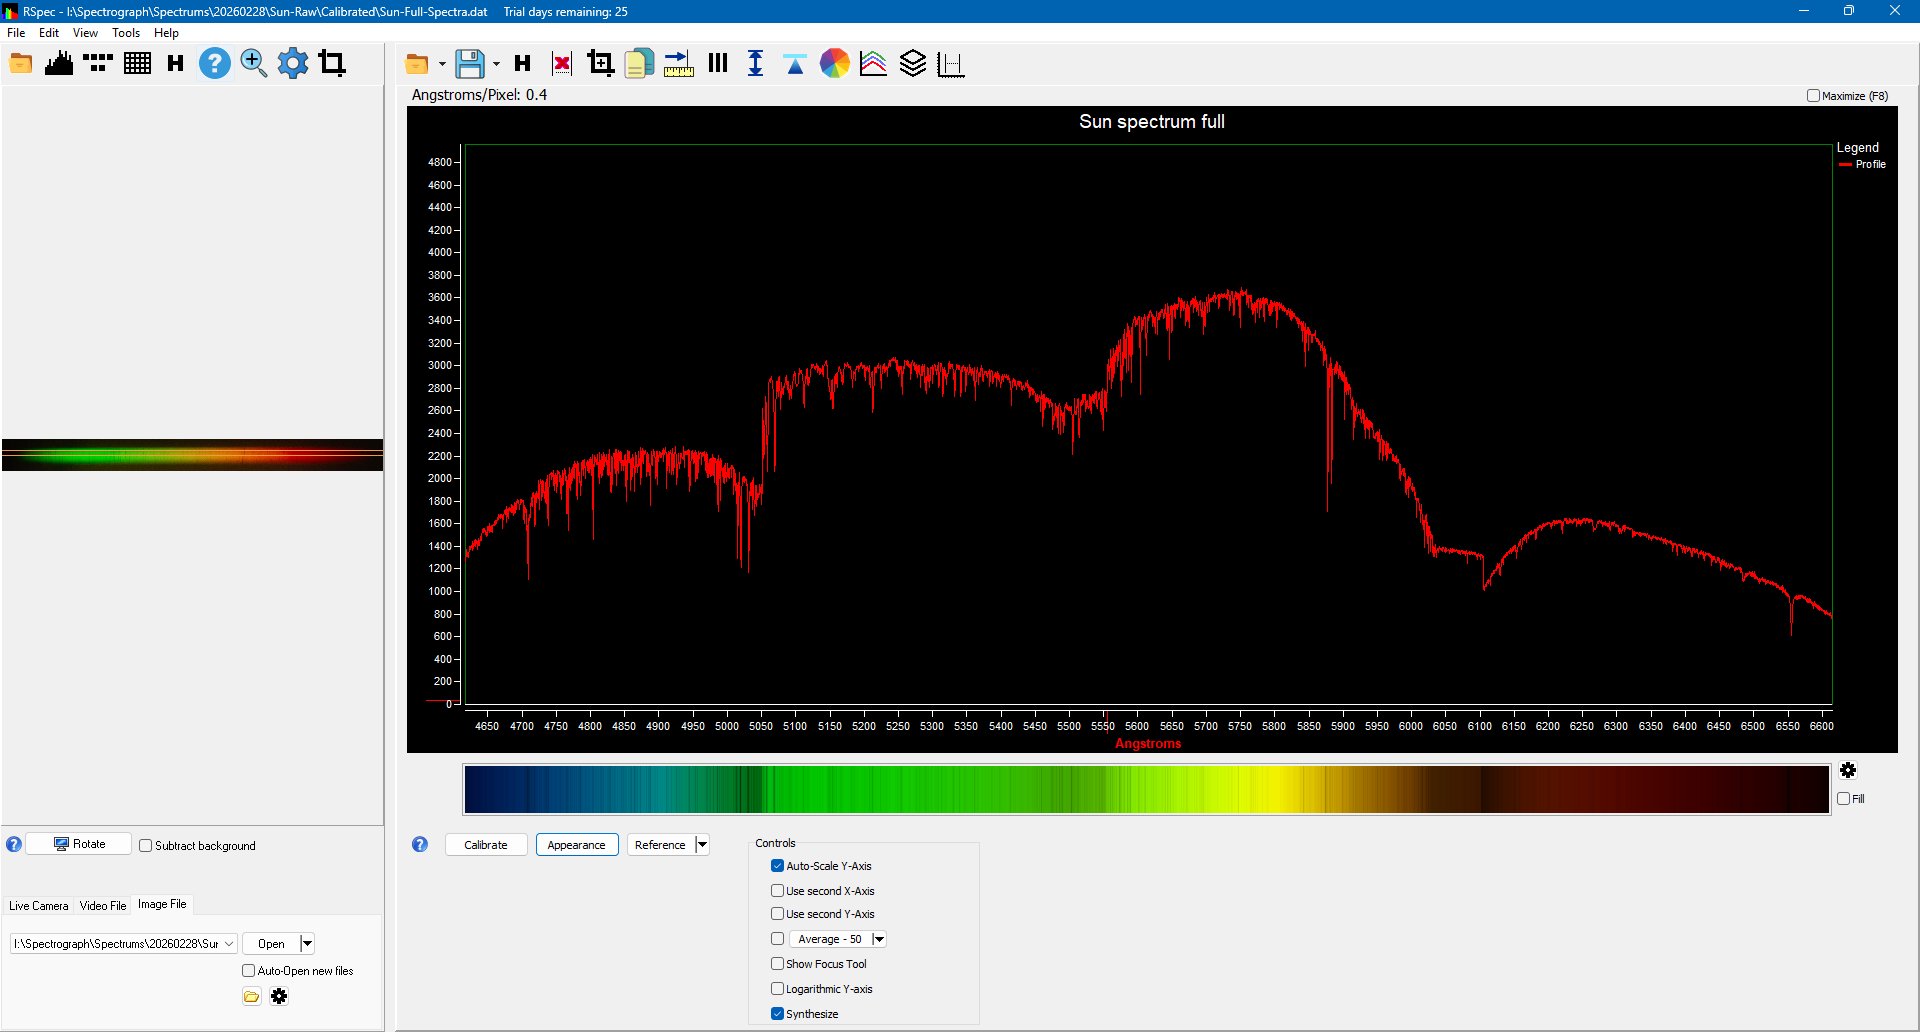
To fix errors in the manual combining of spectrum we will recalibrate it; this is required as we calibrated sections of spectra individually, so there is some variability of scale/resolution, which causes some shifts in wavelengths when all combined.
After combining the spectrum we normalized the spectrum.
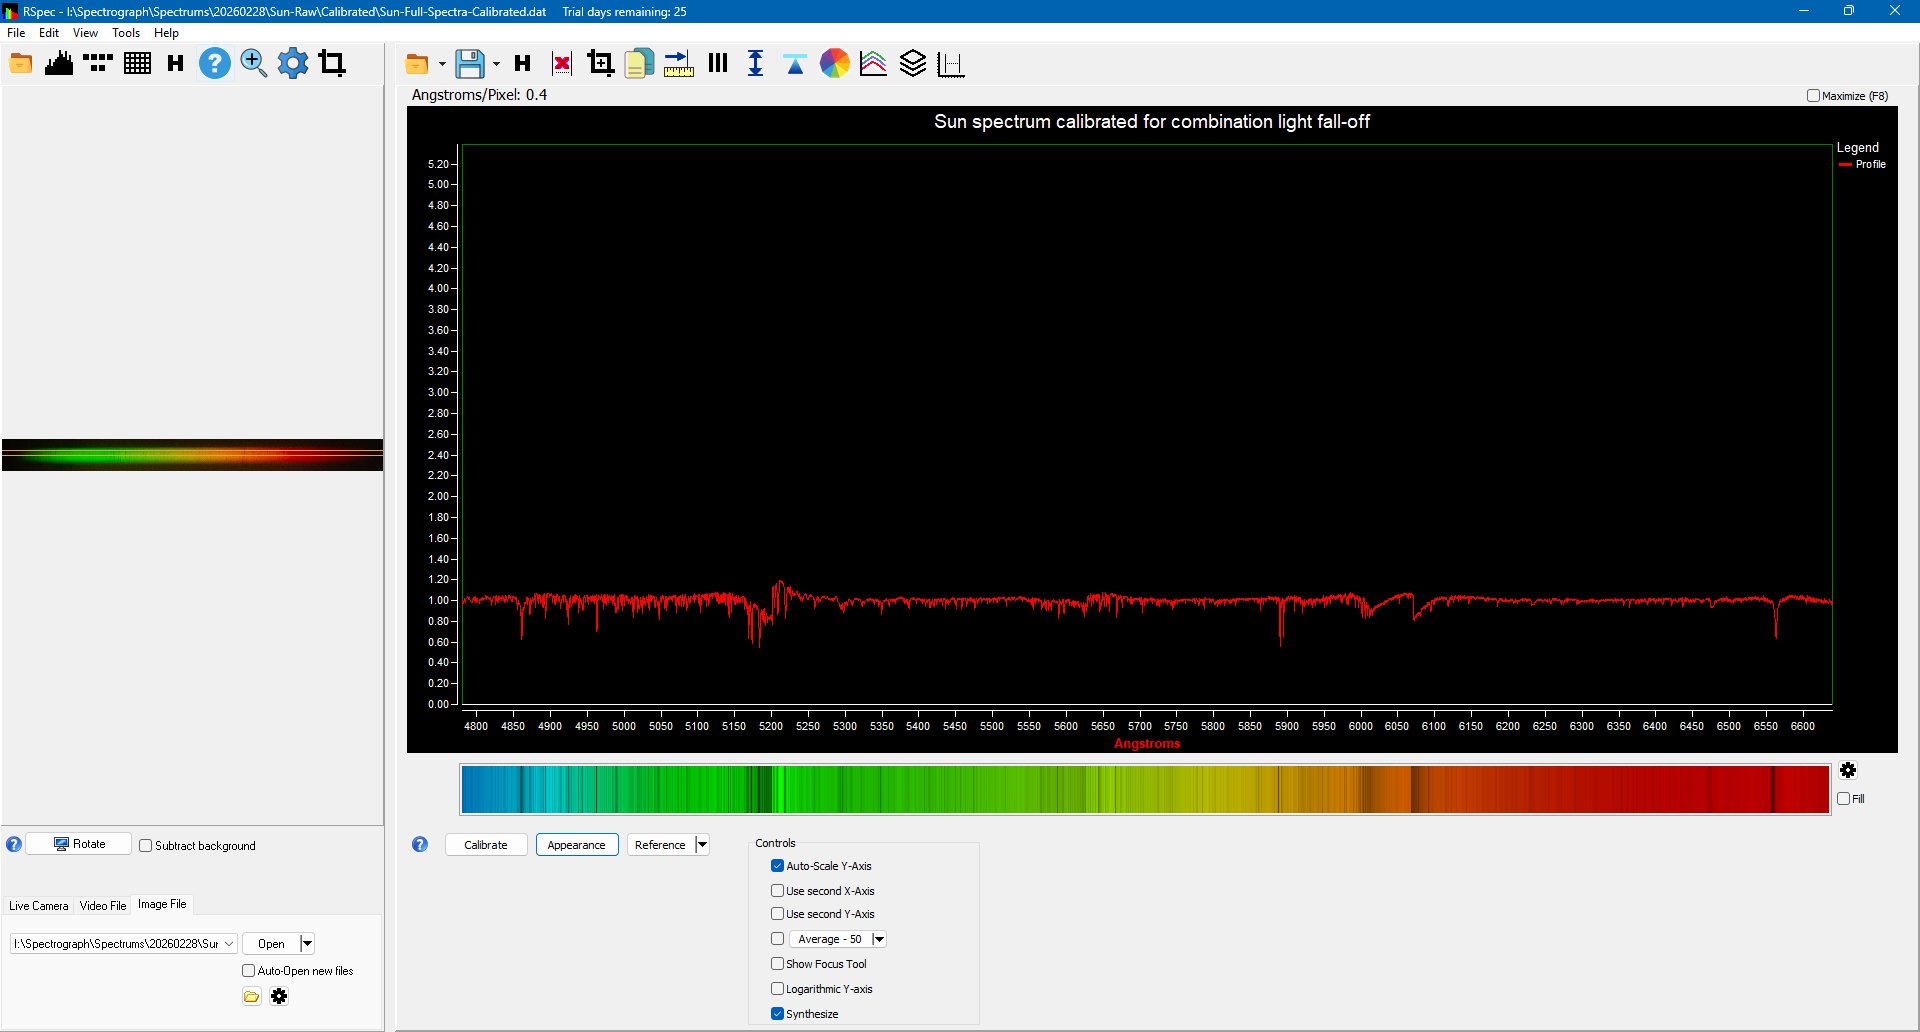
This brings up darker regions of the spectrum to the normal level.
However, as our instruments were far from perfect and could not be calibrated even after normaliztion we can see some darker sections where the spectrums are joined.

But we can ignore these errors and compare our graph to the standard G2V star spectrum
RSpec contains a reference library of all star types, we can compare one by one with our spectrum till we find the closest match.

Conclusion
Spectrum comparison conclusion
So, as per our analysis of data and comparison of reference star spectrum, we can conclude that the spectrum we captured indeed matches the G2V profile

Application
Renewable Energies & Solar Technology
Photovoltaic Cells:
Achieving optimal efficiency in photovoltaic (PV) cells requires an understanding of the sun's spectrum. Since these cells are designed to absorb light at specific wavelengths, the properties of the light they receive have a major impact on energy conversion efficiency. You can optimize the design and performance of the PV cells by studying the specifics of the sun's spectrum under different atmospheric conditions, such as variations in humidity, pollution levels, and time of day. By ensuring the cells function at their best, this optimization can eventually lead to more efficient energy production.
Artificial Sunlight:
Understanding the spectrum of UV light emitted by the sun allows us to make effective use of this renewable energy source. By harnessing specific UV wavelengths to enhance photosynthesis in plants grown under artificial lighting, growers can optimize growth in greenhouses and indoor farms, leading to increased yields and improved nutritional value. This approach supports sustainable agricultural practices, reduces reliance on traditional energy sources, and promotes healthier ecosystems, making the strategic use of UV light essential for enhancing agricultural efficiency and ensuring a more sustainable food supply.
Sources Of Error
Crude Construction of the Spectrograph
As the assembly of the spectrograph is quite basic, it was not very sturdy, and parts of the spectrograph could move by touch; also, all the elements of the spectrograph were not perfect on the optical axis, which resulted in uneven brightness in captured photographs.
Camera Lens Vignetting
With all camera lenses, the ligh fall off at the corners of the sensor, which makes the photograph bright in the center and dimmer at the corners.
Accurate Identification of Wavelengths
While calibrating the spectrum, the selection of points in the graph to assign a reference wavelength was prone to error.
Citations
https://www.britannica.com/science/G2-V-star
https://en.wikipedia.org/wiki/Stellar_classification#:\~:text=The%20spectral%20class%20of%20a,brown%20dwarfs%20(and%20exoplanets).
https://en.wikipedia.org/wiki/Wien%27s_displacement_law#:\~:text=In%20physics%2C%20Wien's%20displacement%20law,unique%20characteristic%20wavelength%20or%20frequency.
https://science.nasa.gov/asset/webb/types-of-spectra-continuous-emission-and-absorption/#:\~:text=Scientists%20often%20classify%20spectra%20based,emitted%20by%20the%20glowing%20gas.
https://phys.libretexts.org/Bookshelves/Astronomy__Cosmology/Astronomy_1e_(OpenStax)/17%3A_Analyzing_Starlight/17.03%3A_The_Spectra_of_Stars_(and_Brown_Dwarfs)#:\~:text=of%20the%20spectrum.-,Classification%20of%20Stellar%20Spectra,L%2C%20T%2C%20and%20Y.
https://greenfrogsystems.com.au/glossary/solar-spectrum/#:\~:text=The%20solar%20spectrum%20is%20expressed,sources%20while%20preserving%20environmental%20quality.